How to create a map ?
This guide will help you build your first Map to display some geographical information from Records. Users will then be able to see the data they have filled in and interact with it.
Create a map widget
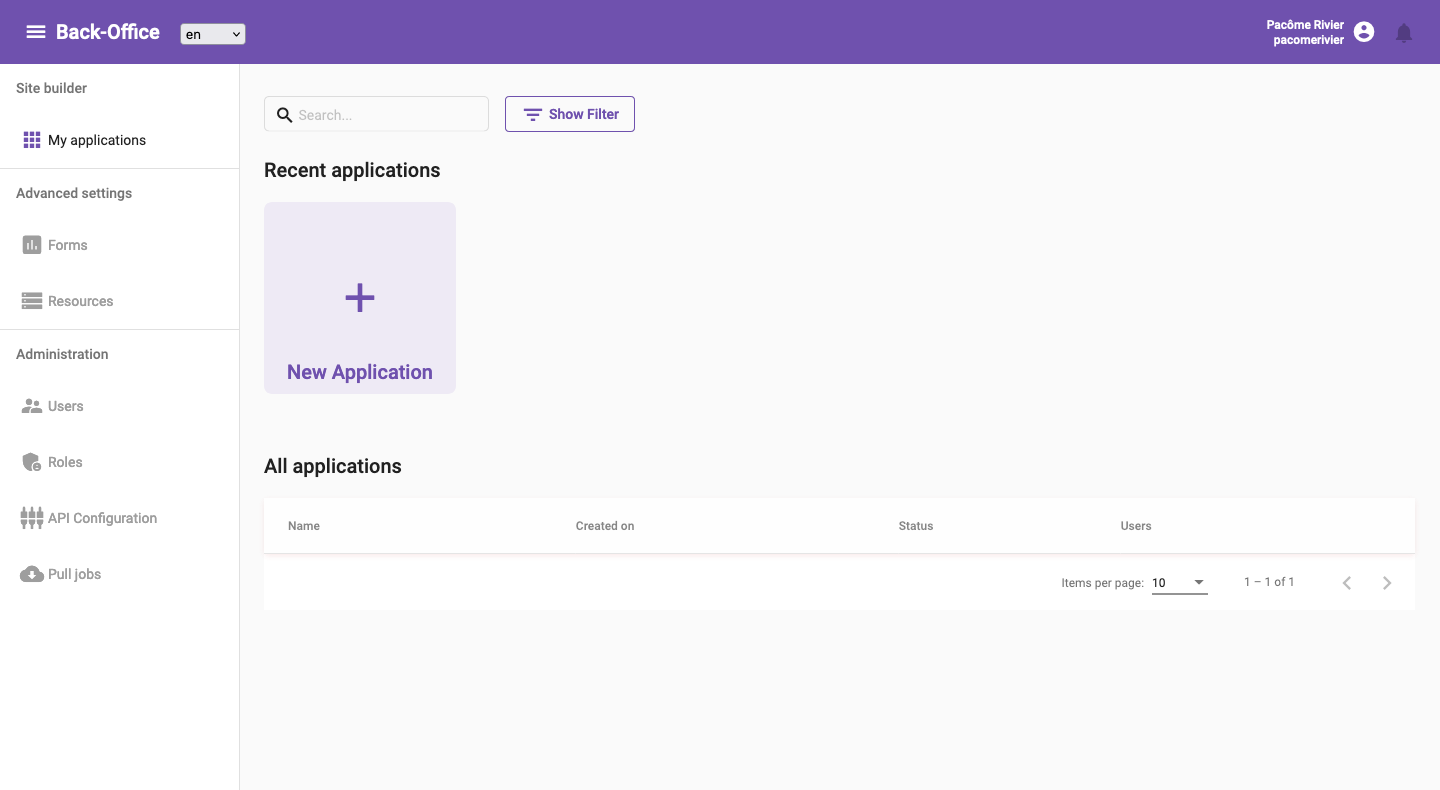
A map is a type of Widget, so you must first have an Application and a Dashboard page to create a grid widget. You can quickly create an application by going to the Applications page and clicking on the New Application button.
Applications page with New Application button
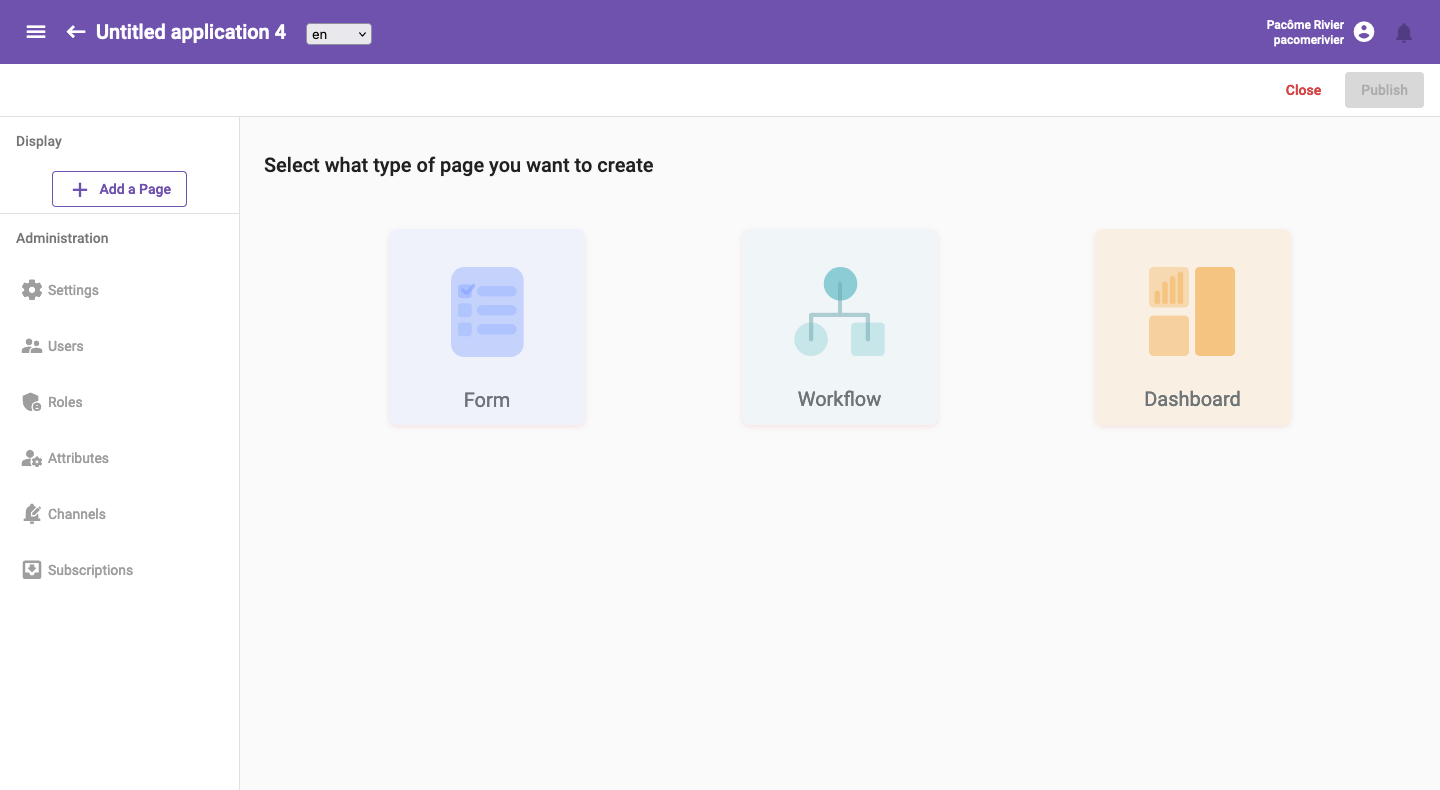
Then you can create a dashboard page by clicking on the Add a Page buttton and selecting the Dashboard type of page.
Add a dashboard page
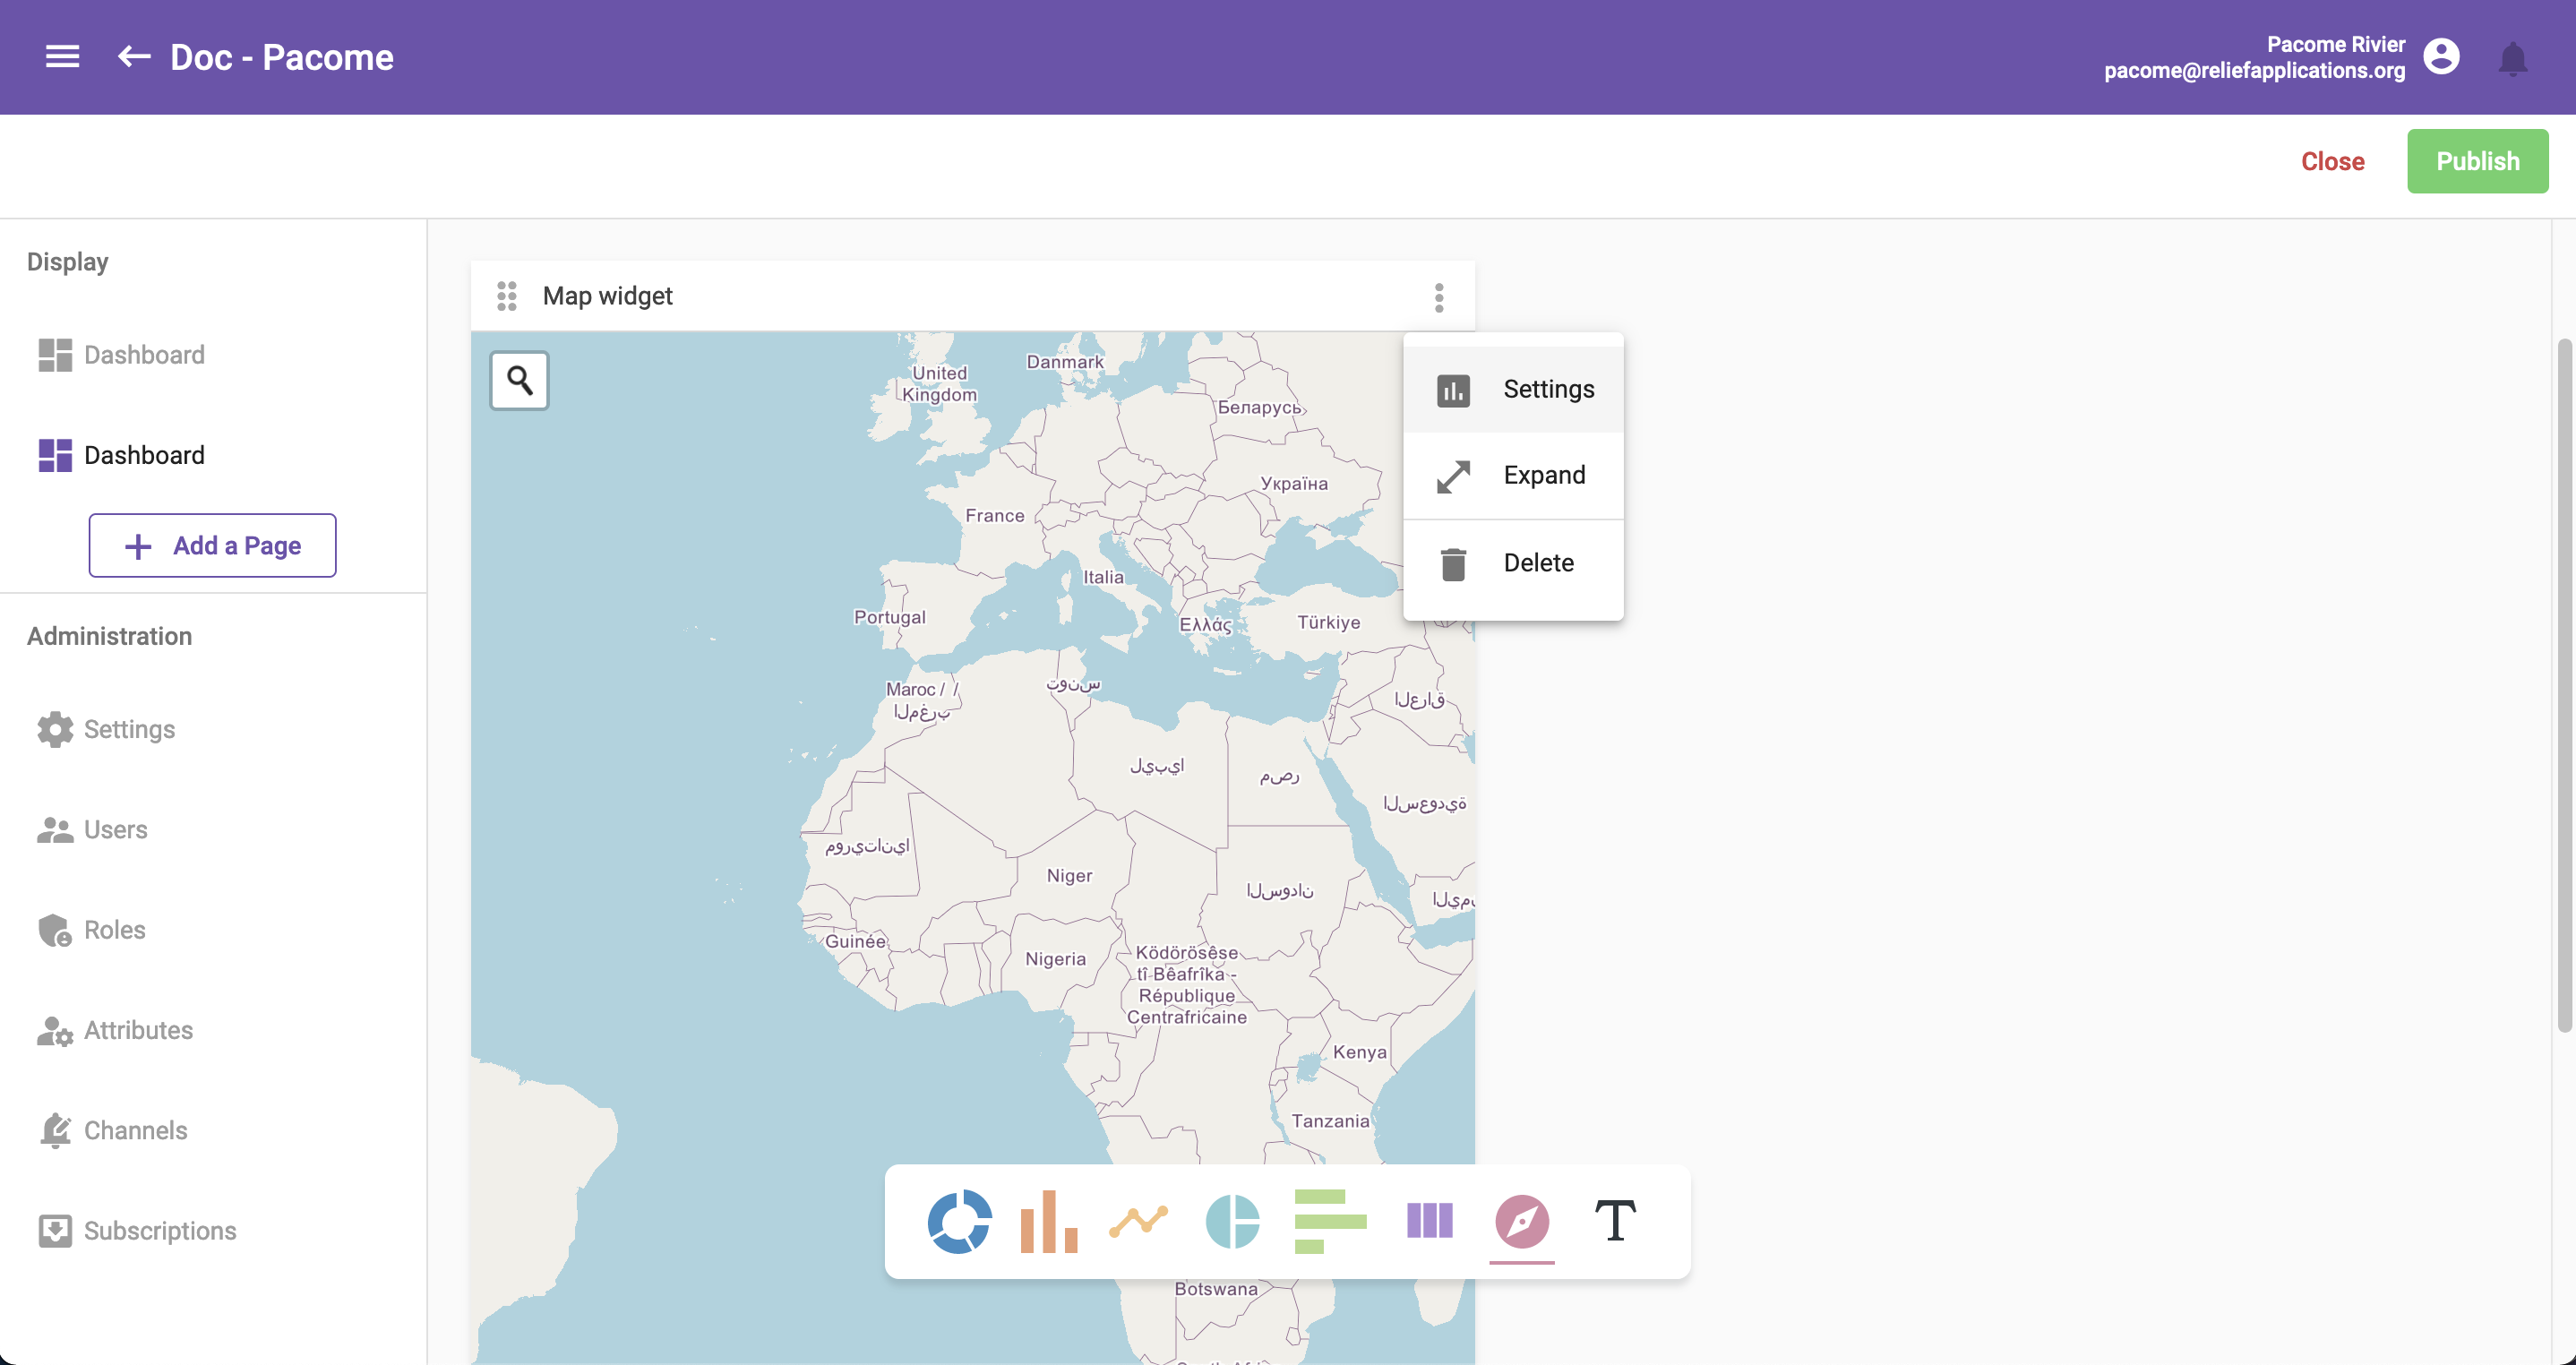
Finally you can create a Map widget by clicking on the corresponding icon.

Select dataset
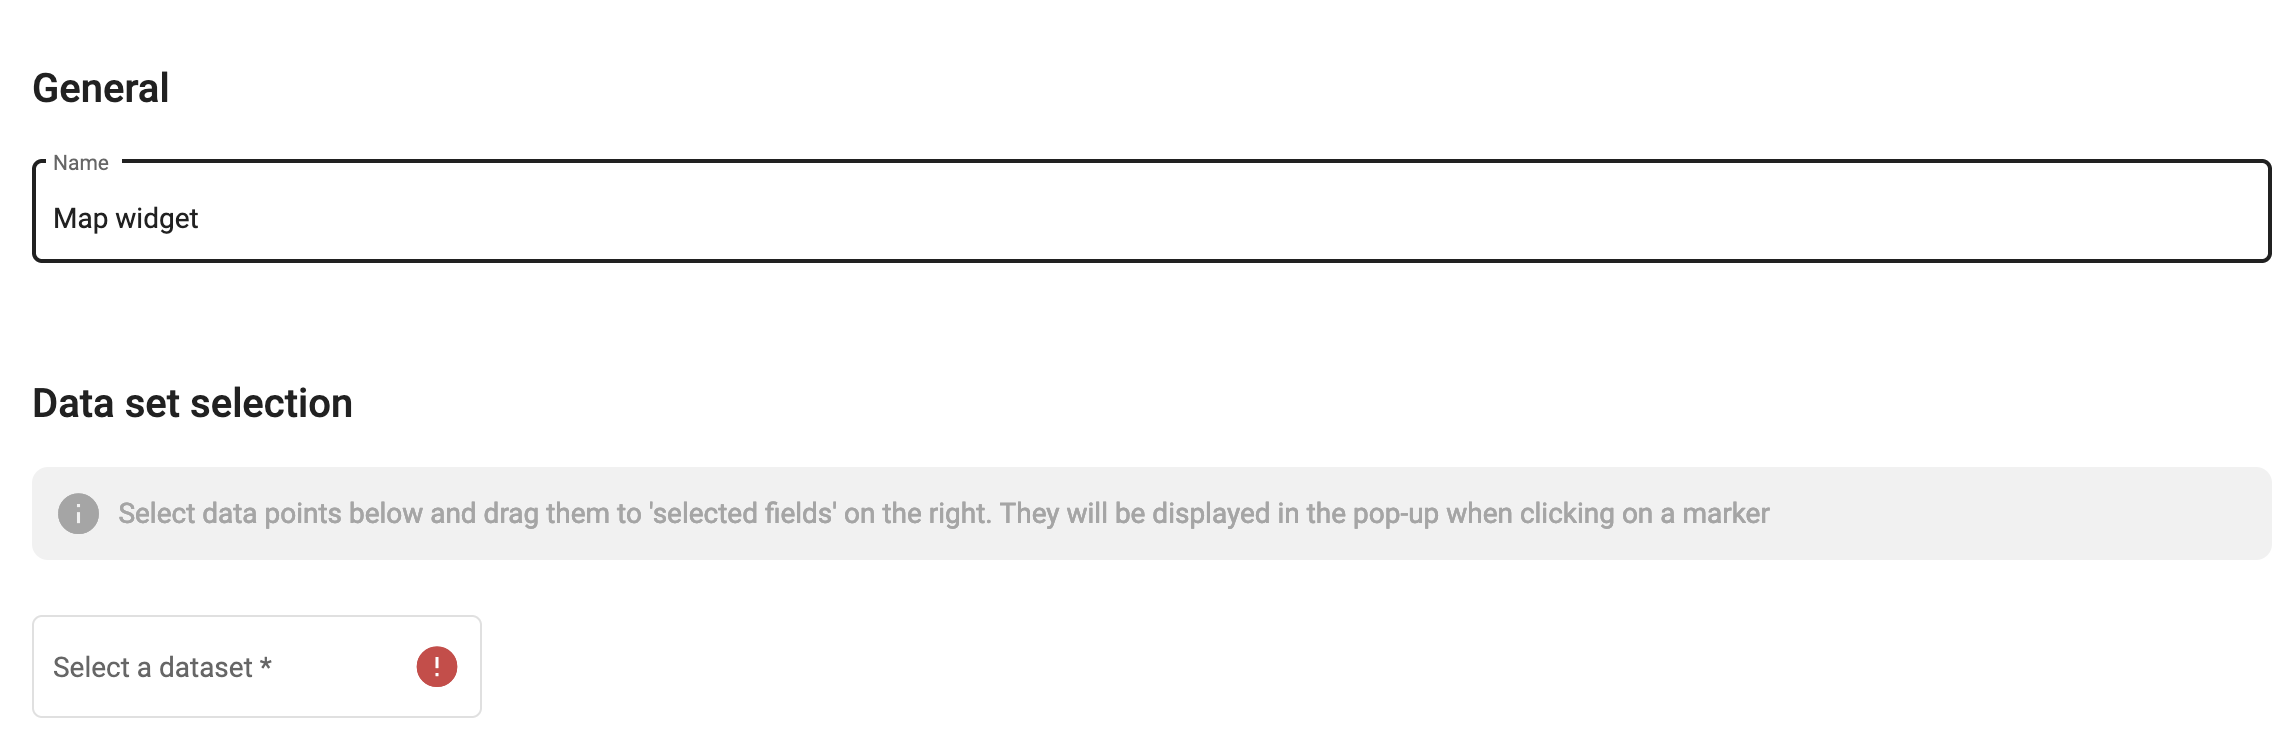
Once the widget is created, the first thing to do is to select the dataset from which you want to display records geographical data. You must open the Settings and select the dataset under the General tab using the dedicated text input with autocompletion.
Open settings and select dataset
Click on the Settings button.
Select a dataset.
You can select either a Form dataset type or a Resource one. The difference will be that with resources, you will get record from the Core Form and all its children whereas with a simple form, you will only get records from itself.
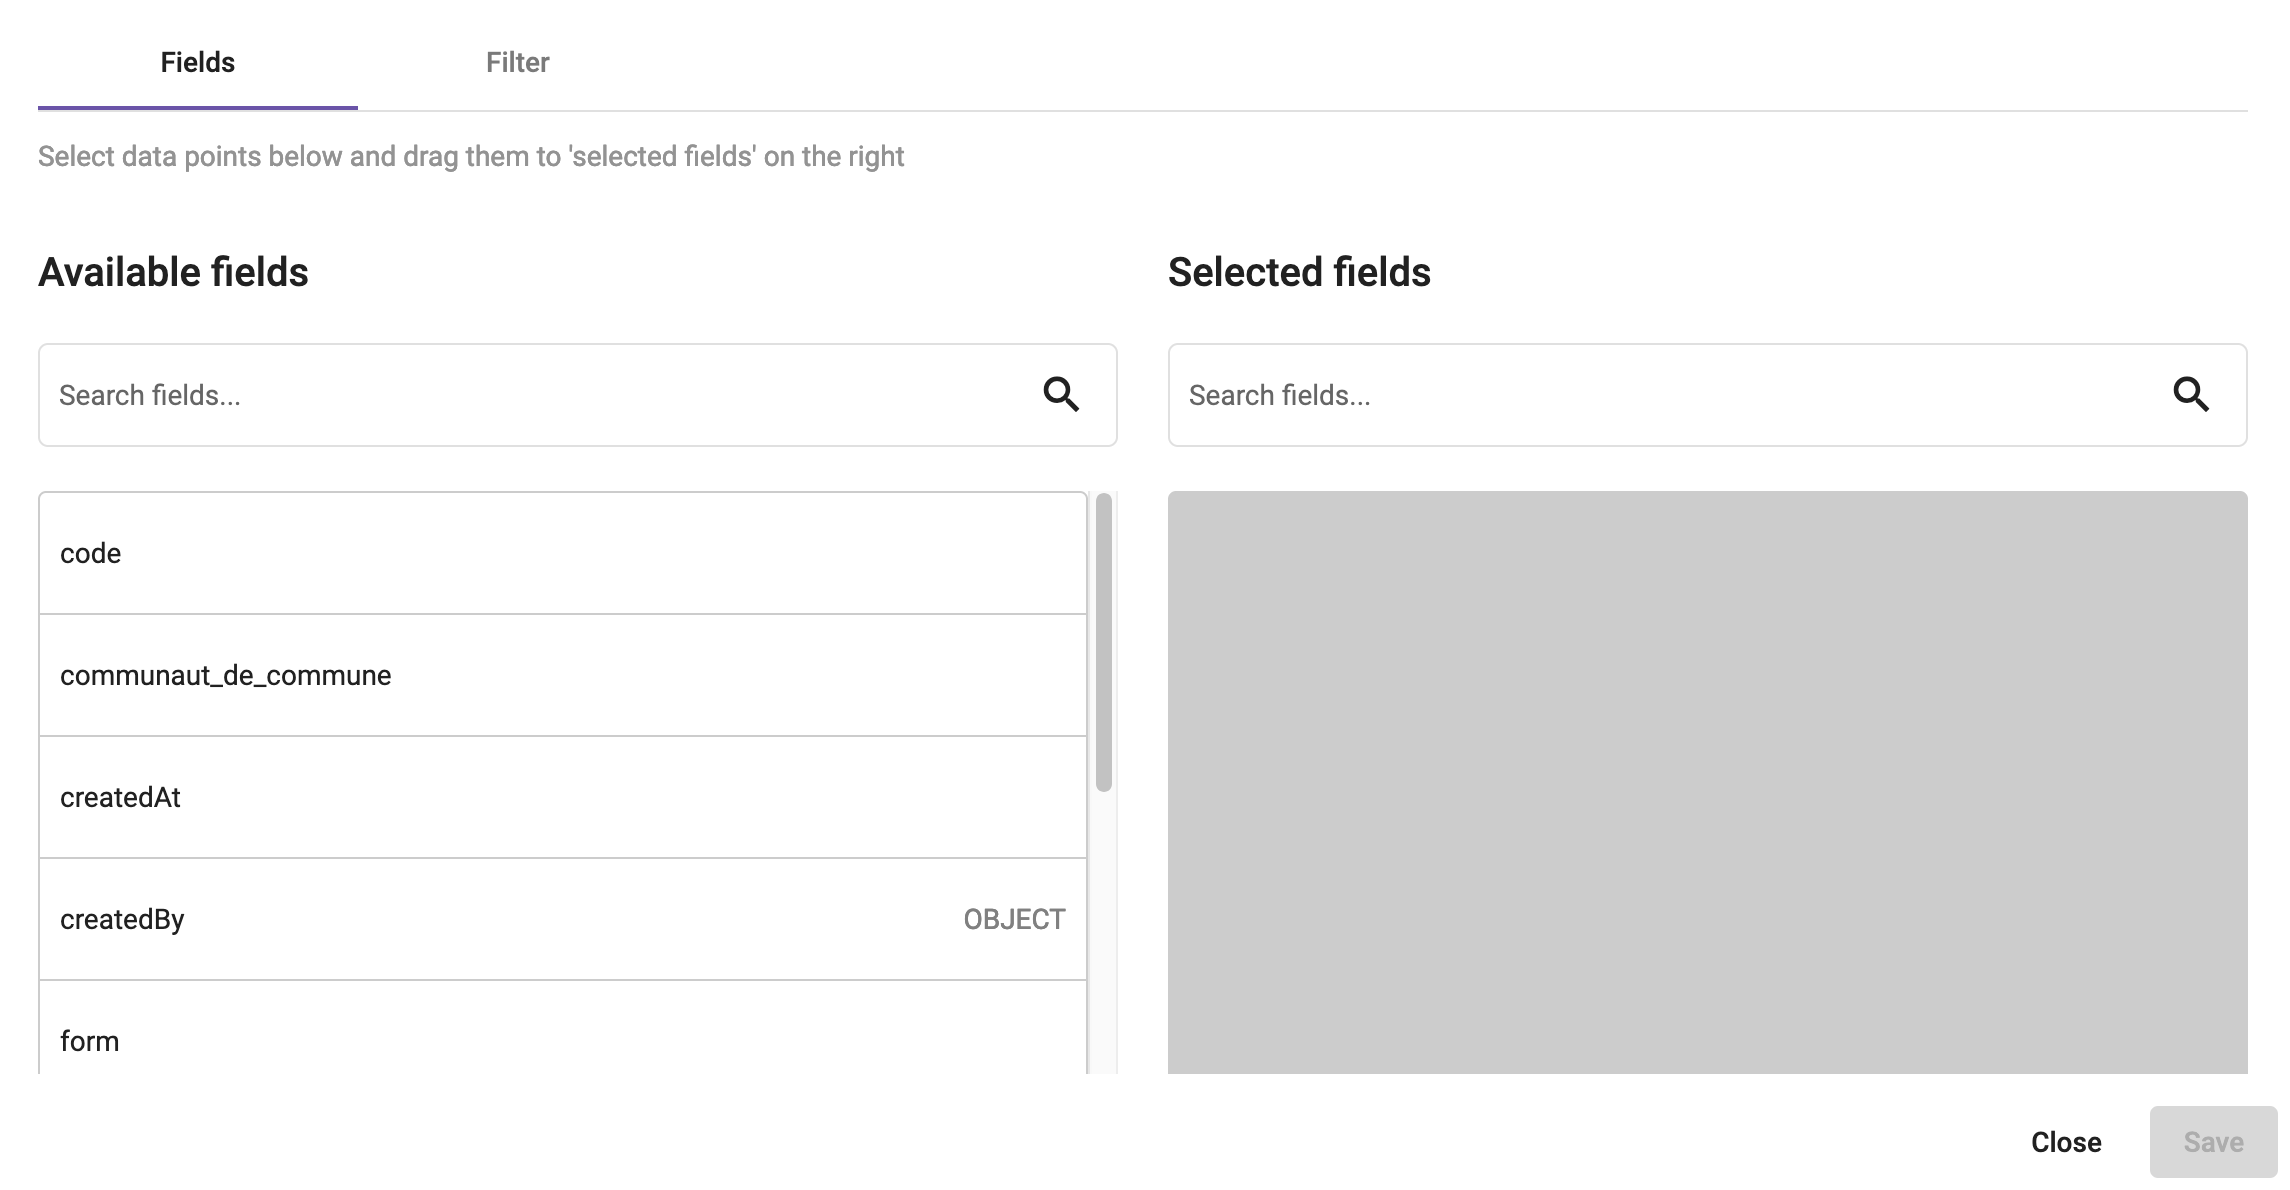
After selecting the dataset, you should also select fields containing useful data in order to build the map. You can even filter out some data from the dataset using the filter tab.
Select useful fields
Add layers
Now that we have selected our datasource, we can move to the Layers tab and use it to create two type of layers:
- Markers which are group of points.
- Clorophlets which are group of polygons.
You can also add external layers coming from arcGIS online public repository.
Markers
Oort can create layers of markers from the selected dataset, It will create one marker for each Record. You need to configure which fields will be used for the latitude and the longitude on all the records.
Map geolocation fields
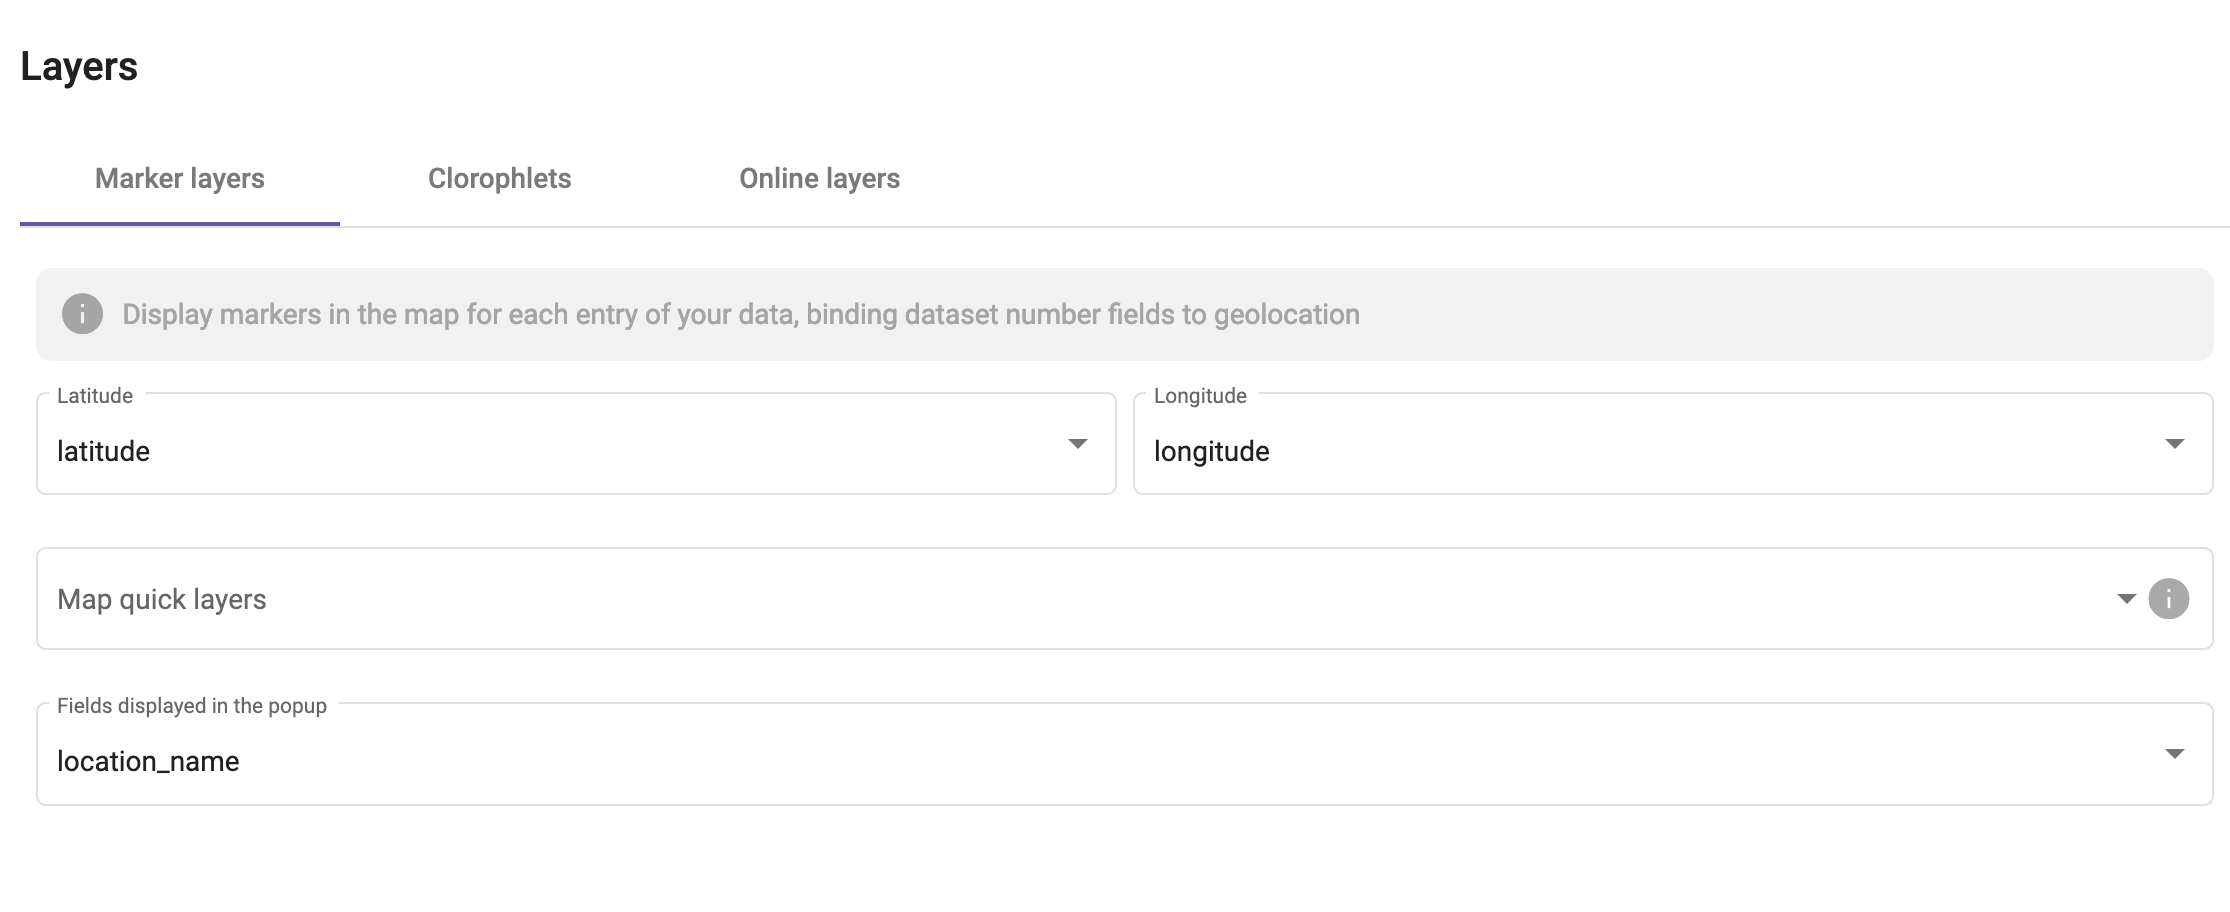
You can easily create multiple layers of markers by using the Map quick layers field. You must put here a selectable field and Oort will create a layer for each choice of this field.
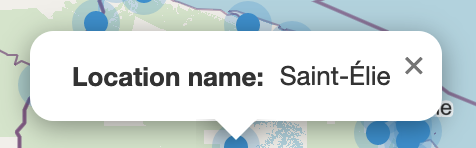
You can also select fields displayed in the popup appearing when a user click on a marker.
Clorophlets
If you want to add a new layer of clorophlets, click first on the Add new clorophlet button.
Then you should upload a geoJSON file containing polygons you want to display on the layer. Once the file is uploaded, you should map an identifier from the dataset's fields to the geoJSON identifier.
You should double check your field type is the same as the identifier type in the geoJSON (Text or Number).
Clorophlet settings
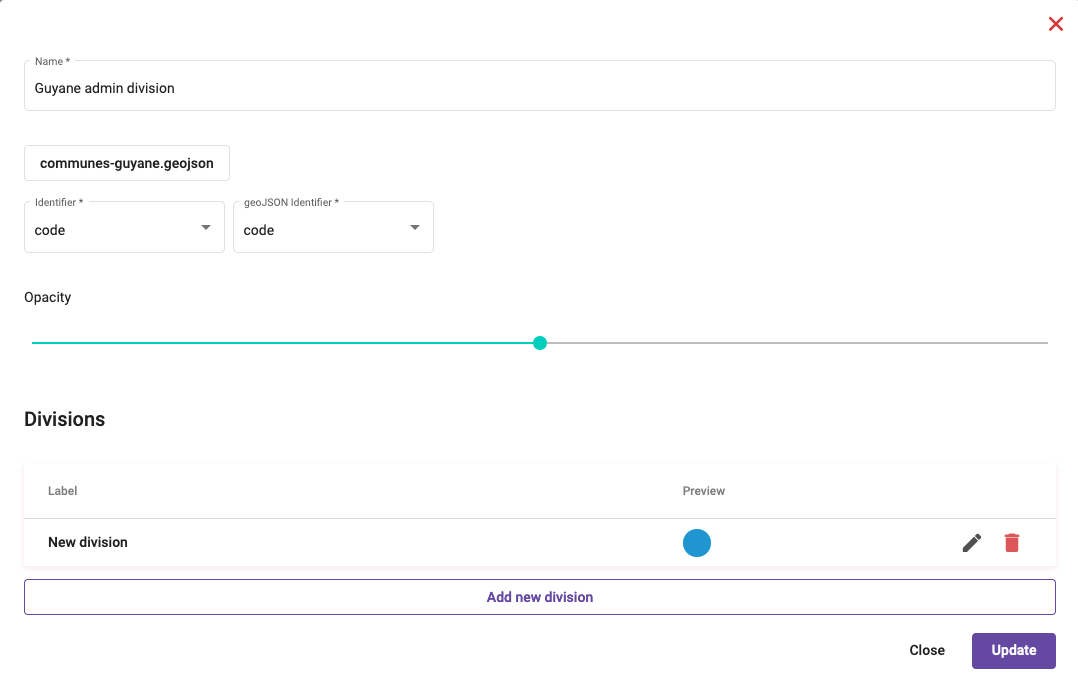
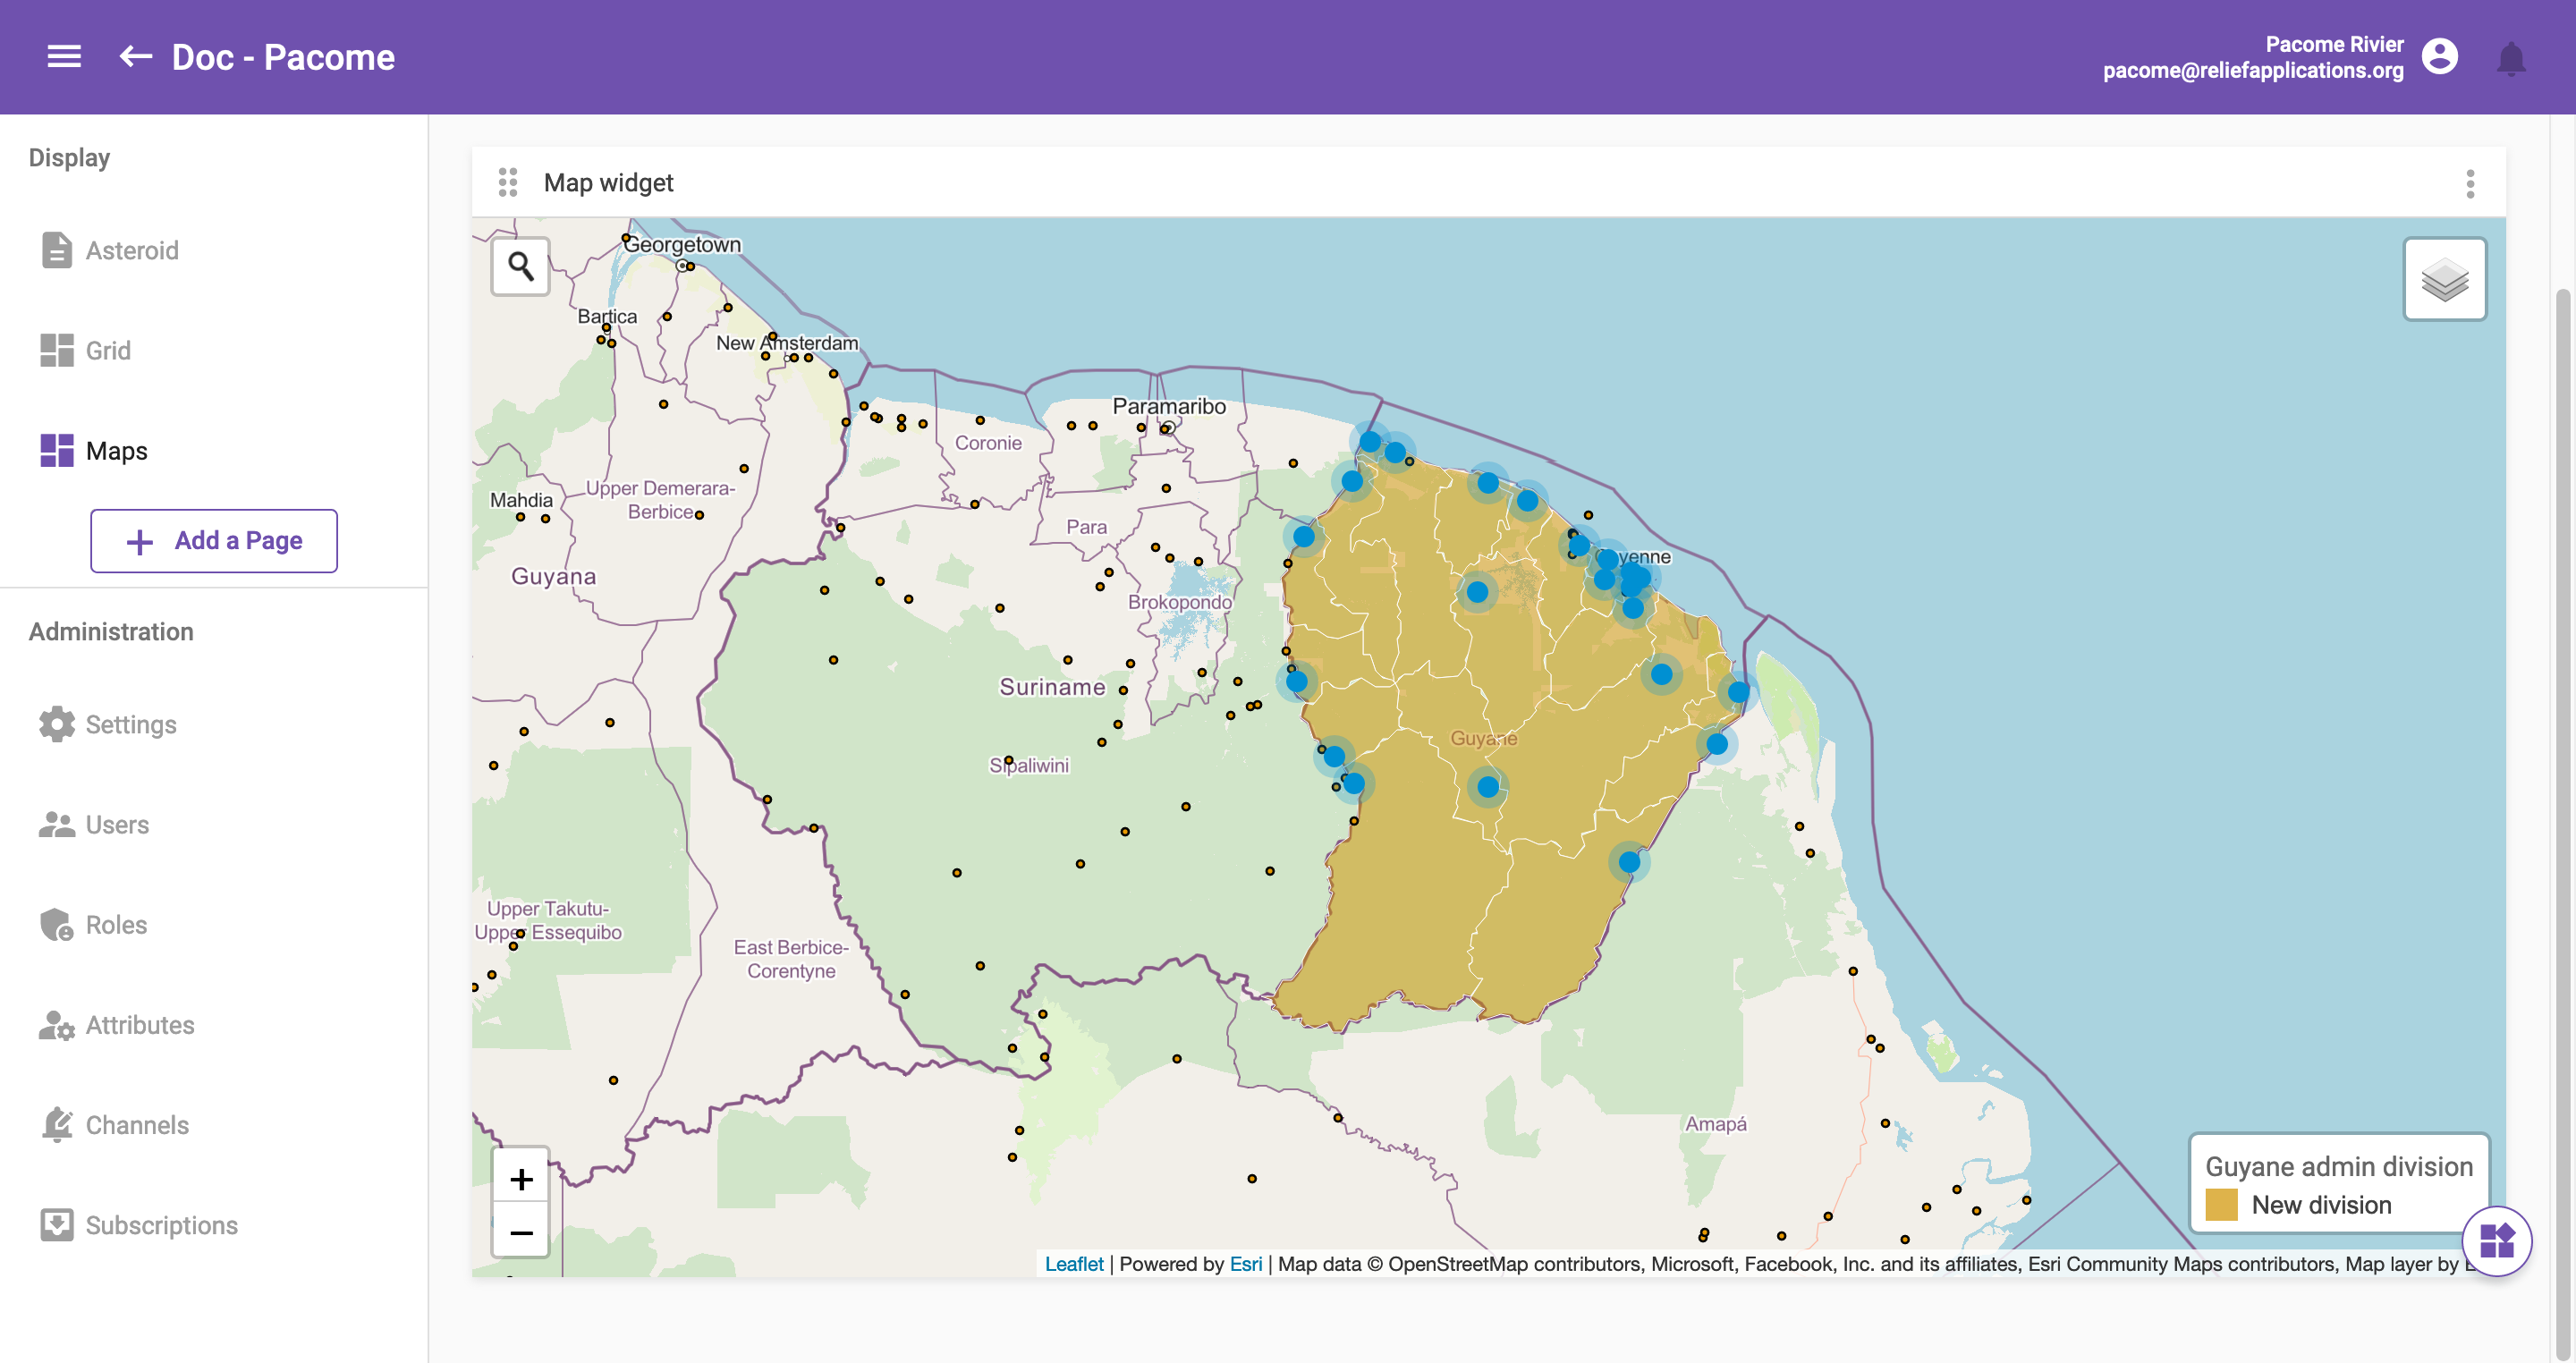
Finally you can select the opacity of this layer and you should at least add one Division with empty filters to set the default color of the polygons.
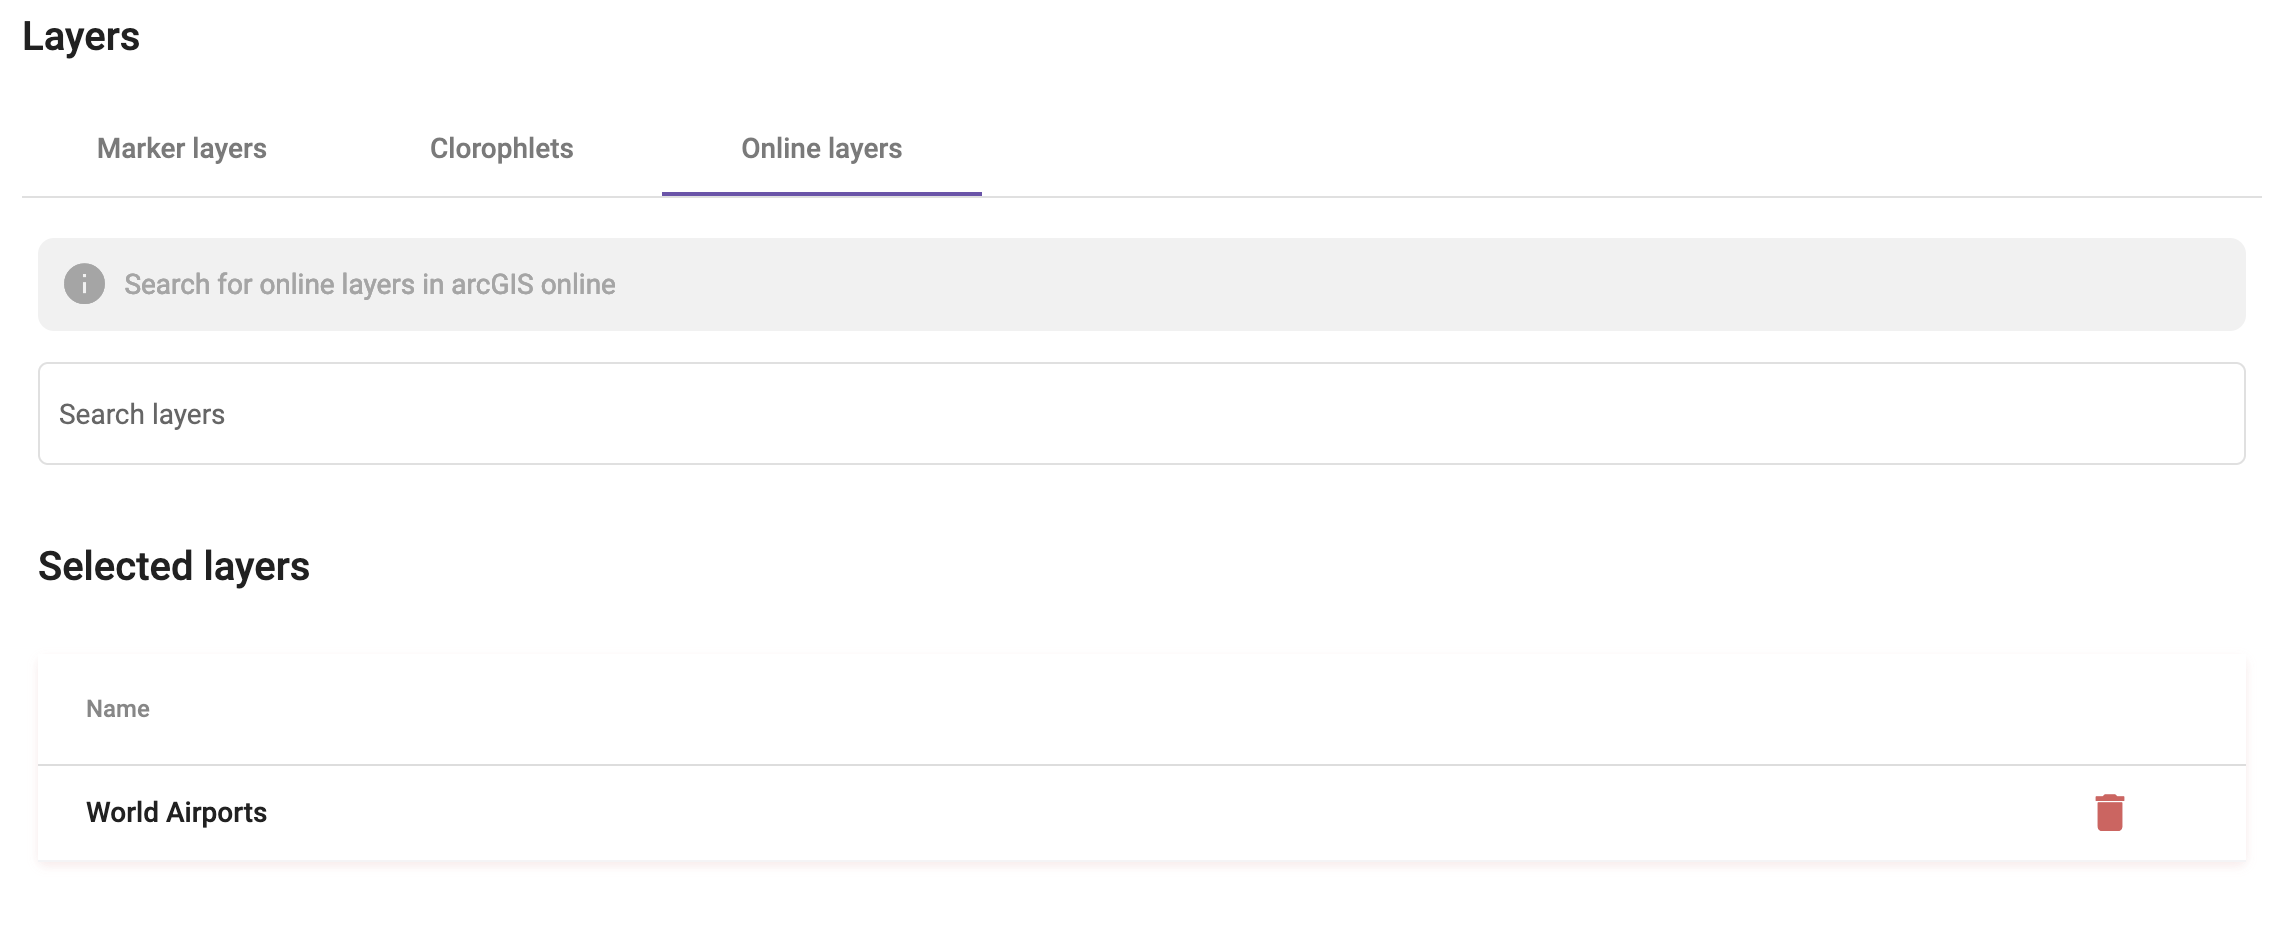
Online layers
Type any keyword into the search box to browse through arcGIS online's public layers. Once you have selected a few layers, you can always remove them from the selection they are not interesting anymore.
Online layers tab
Configure default parameters
Once layers are built, we can finally customize the overall look of our map using the Map Parameters tab.
Map parameters tab
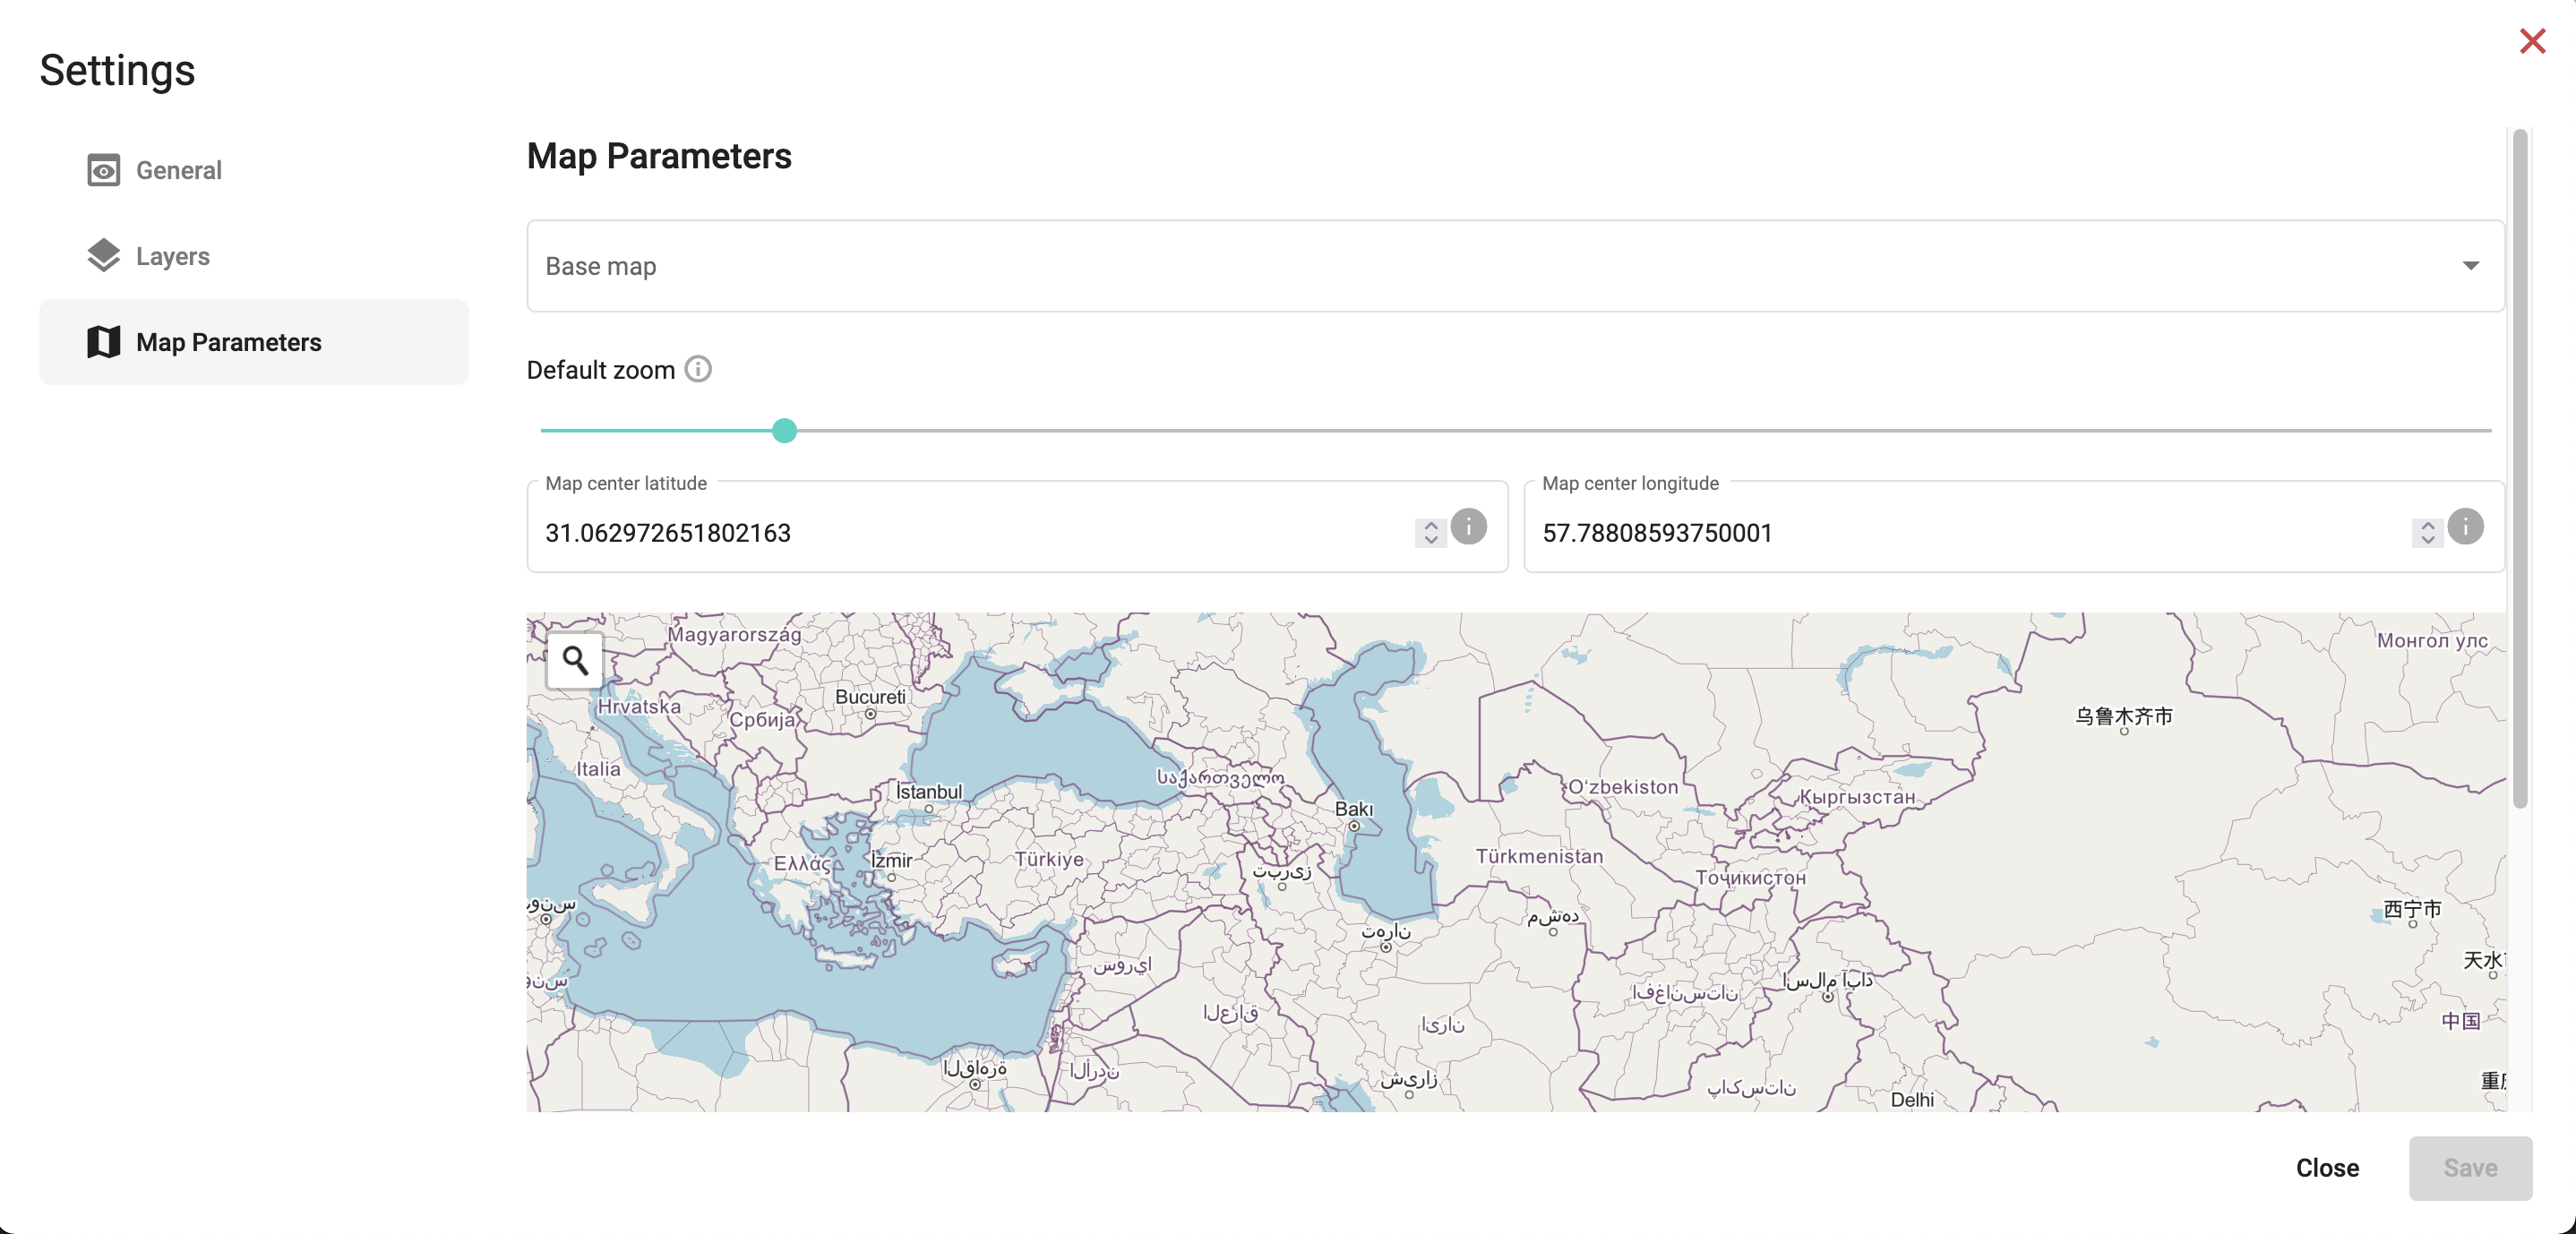
Base map
You can select the base map among more than ten different styles.
The base map is the map displayed on the last layer at the back of your widget. It's the one providing geographical context such as country boundaries to help understanding better dataset layers above it.
Default zoom
Set the default zoom for your widget. It can be done using the slider or zooming directly on the map preview.
Map center
Set the default center point for your widget. It can be done with number inputs for latitude and longitude or by moving around the center point on the map preview.
Advanced features
If you want to go further, you can check the following links: