Give meaning to your data
Create a grid
Now we want to use our data. For this, we will create a grid to show them.
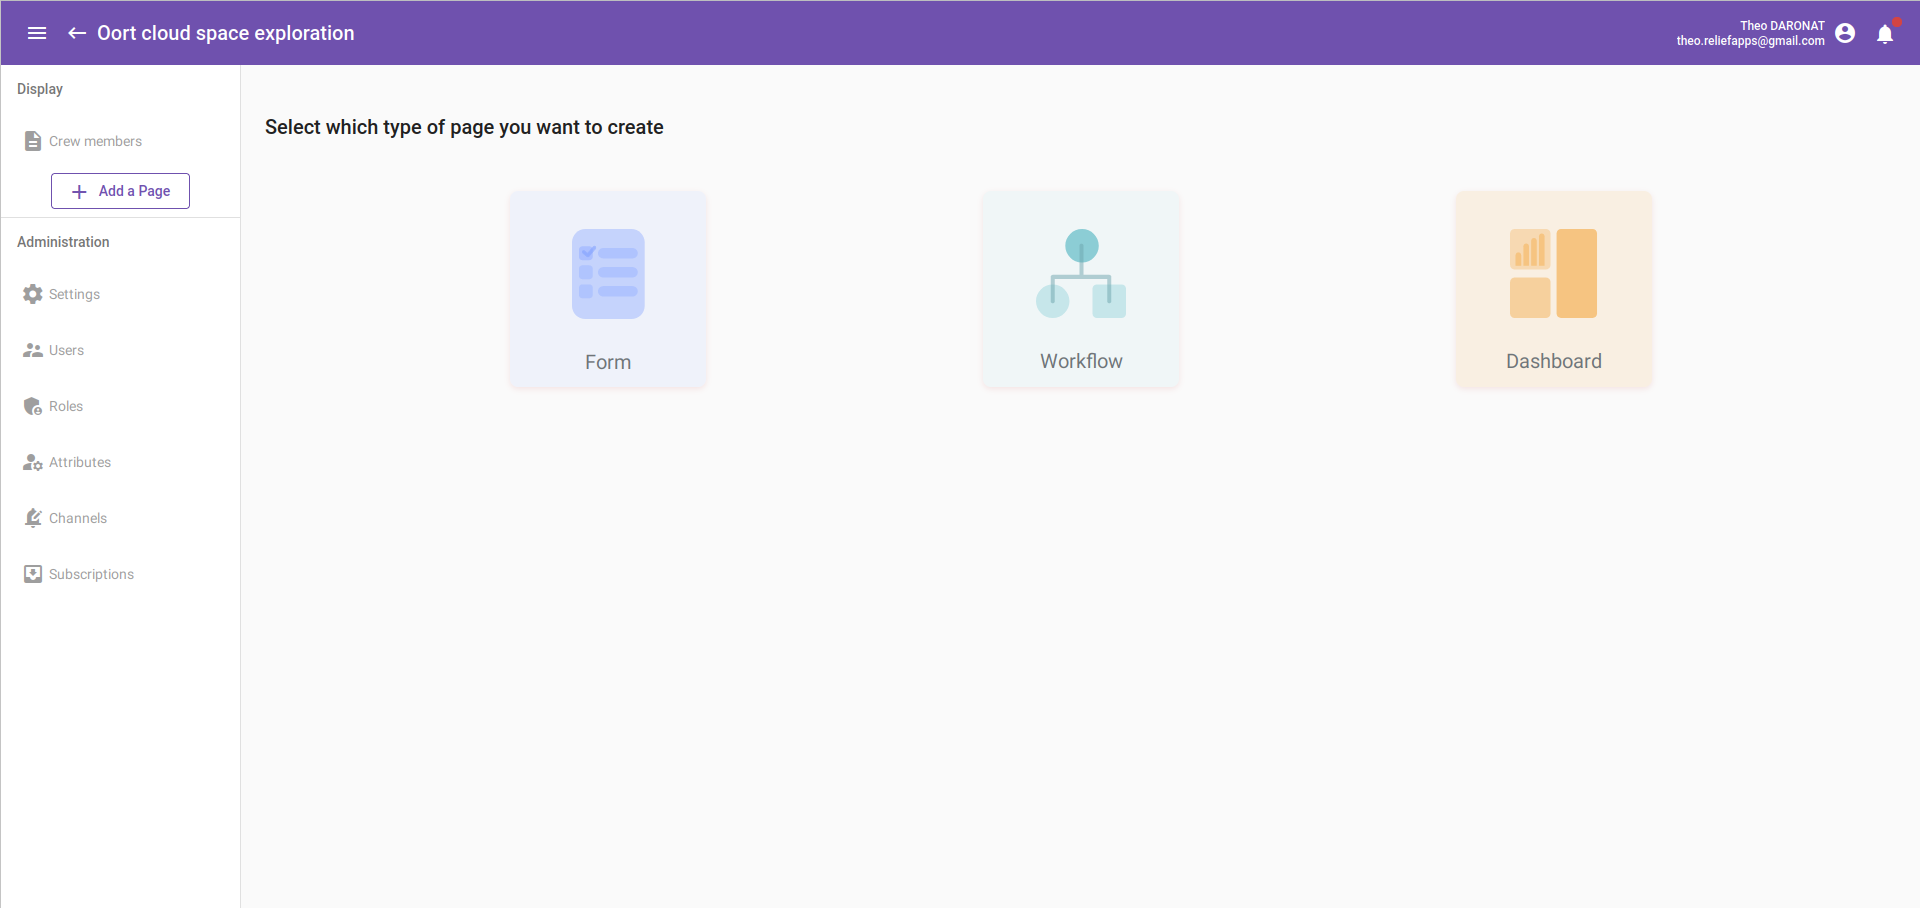
On the application page, click on the "Add a Page" button at the top left as for the form and, this time, select "Dashboard".
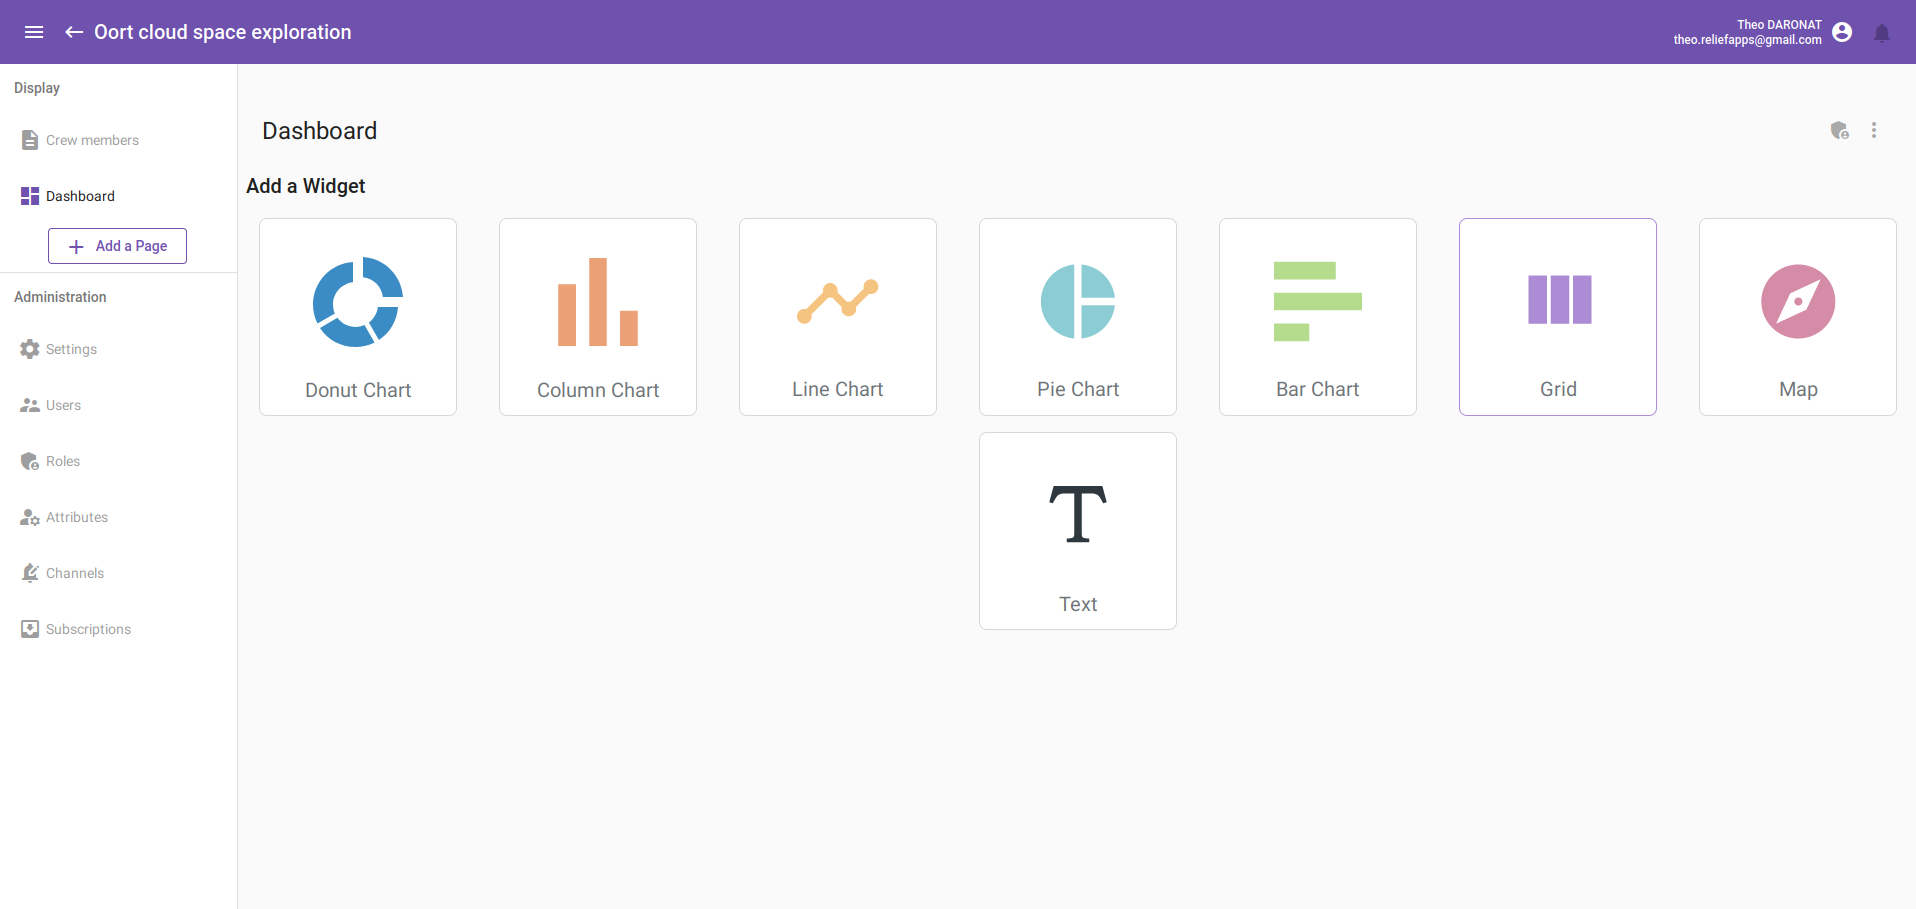
You have the choice between multiples widgets. For this tutorial we will see only the grid one, I let you discover the others in the Features list documentation. So click on the "Grid" icon.
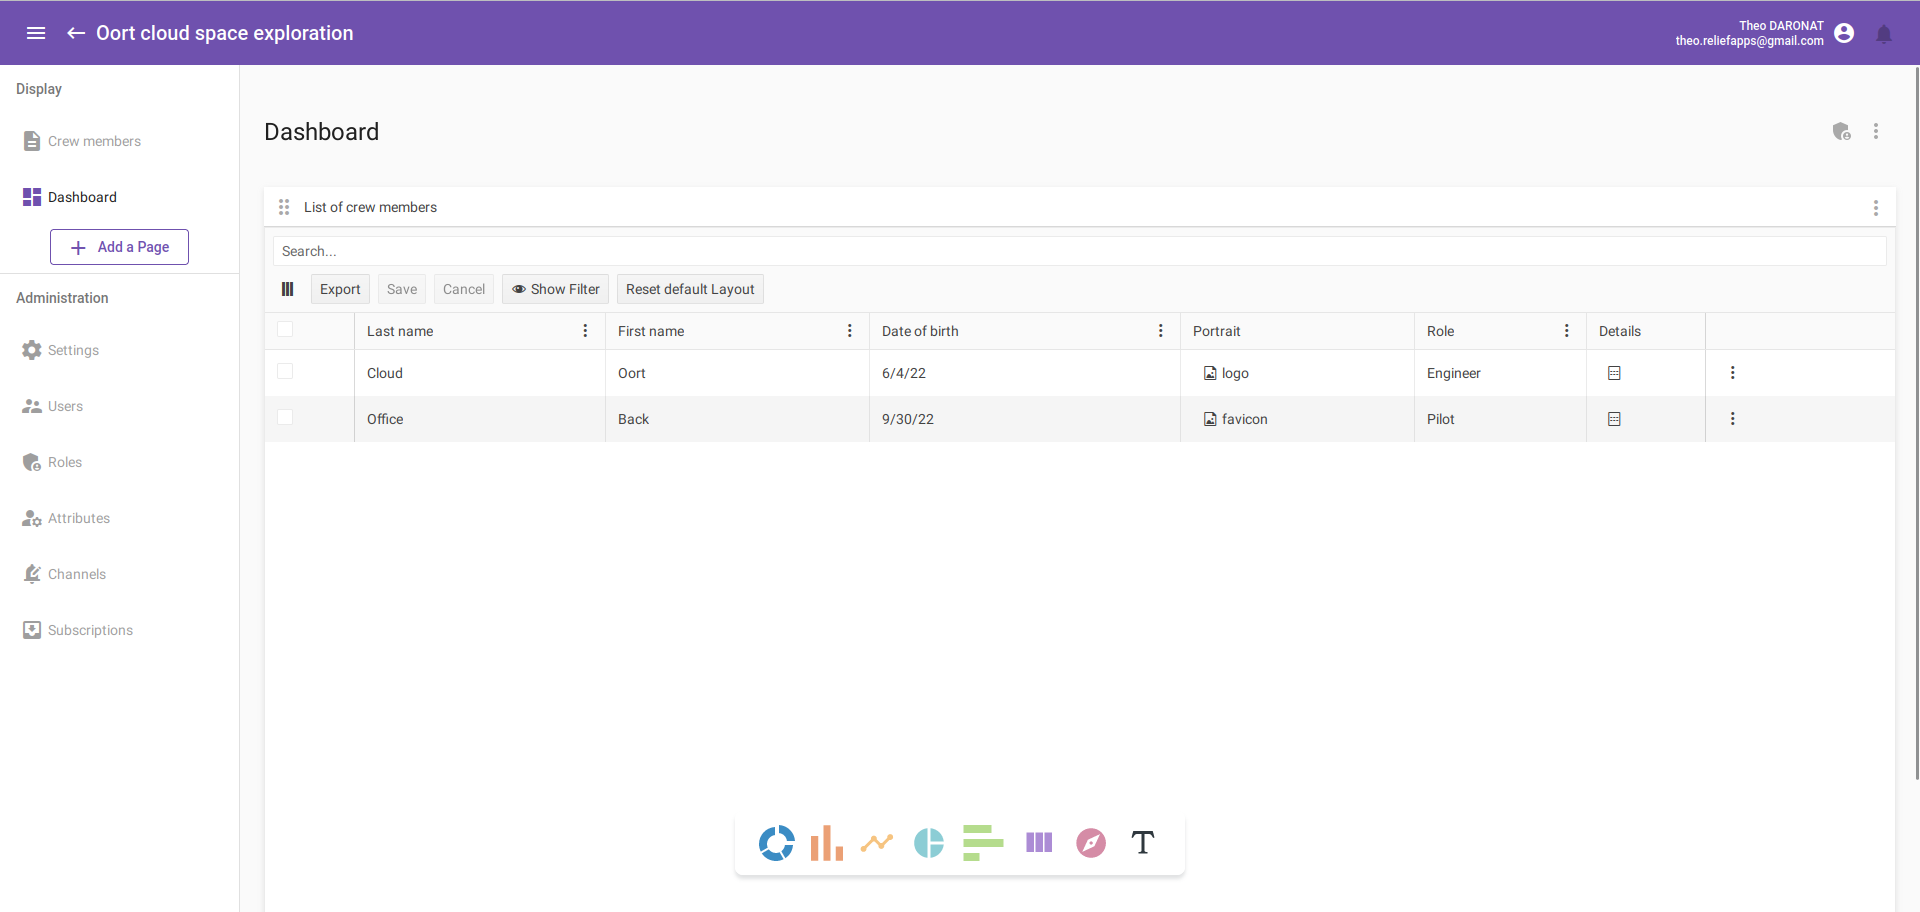
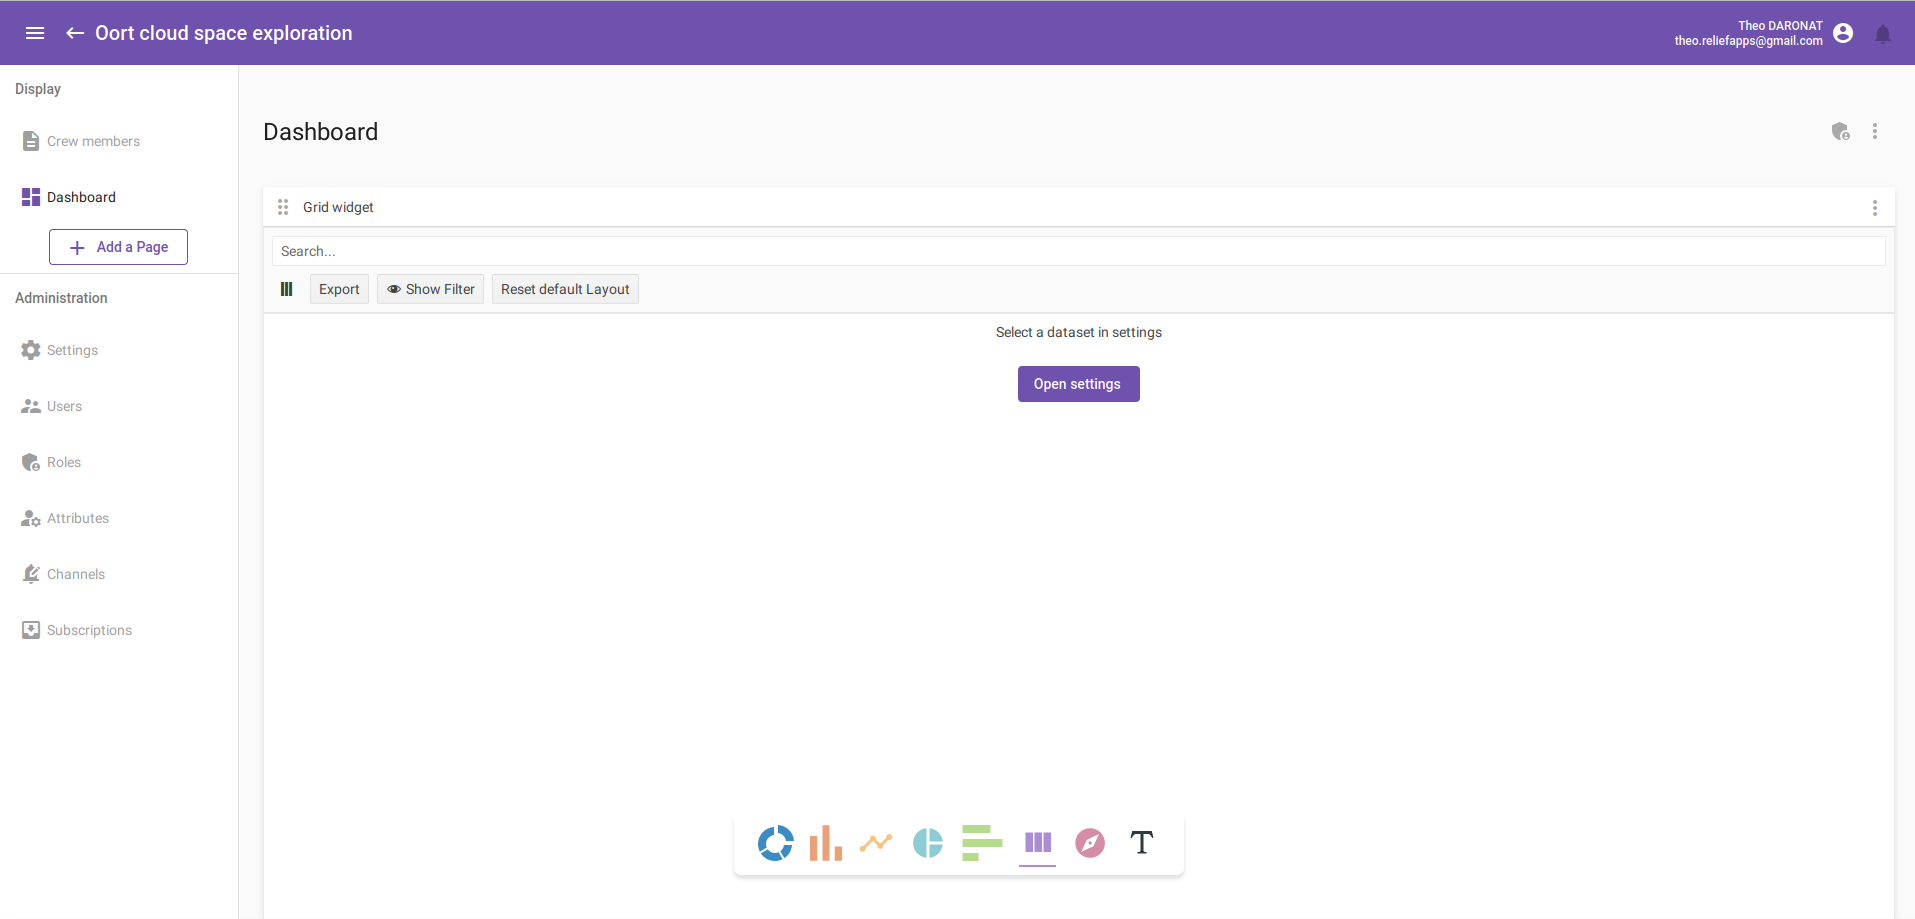
You should have a page looking like the following:
Configure a grid
Grid settings
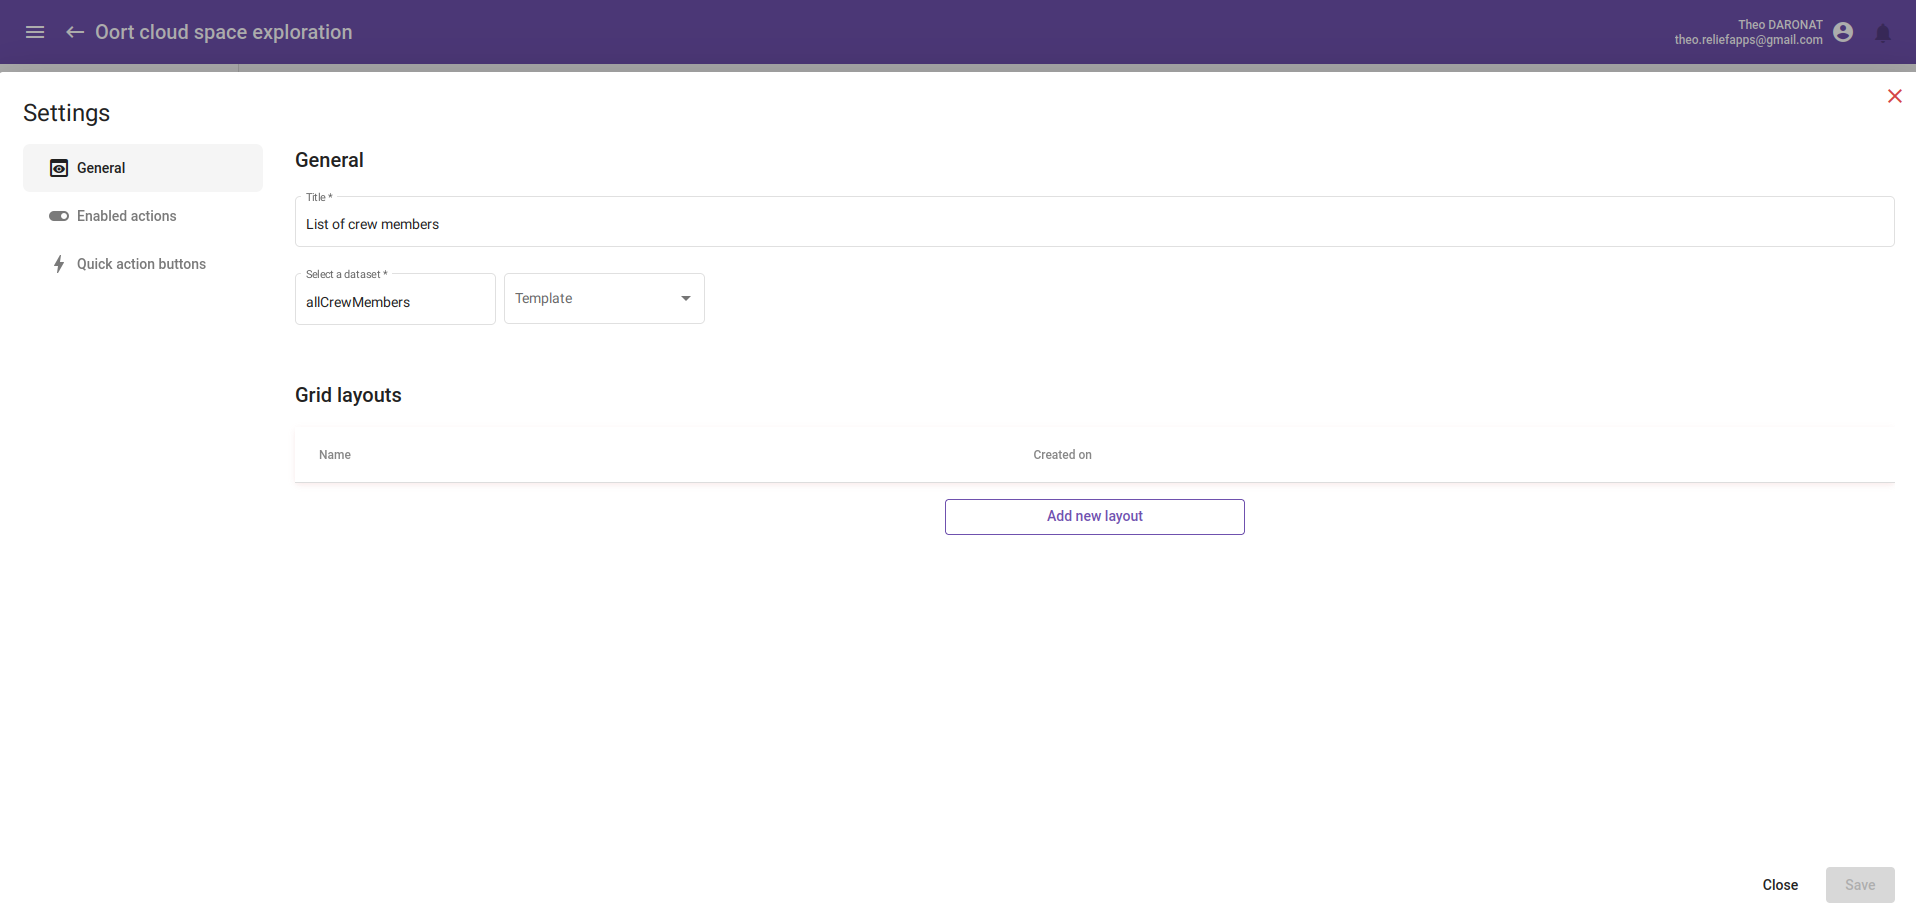
For the moment, the grid is empty. We have to select a dataset and create a layout to choose what informations we want to show. So, let's open the settings by clicking on the "open settings" button or by opening the setting with the three circle icon at the top right of your grid.
Change the name of the grid to the one you want and select the dataset you want to use. For us, it will be the "allCrewMembers", it is the one with the same name as our form. After that, we want to define wich information will be displayed, for this create a new grid layout.
Becarful, the "grid layouts" part appear only if you have selected a dataset. Make sense, you need a dataset to display data!
Layout settings
First, enter a title for your layout.
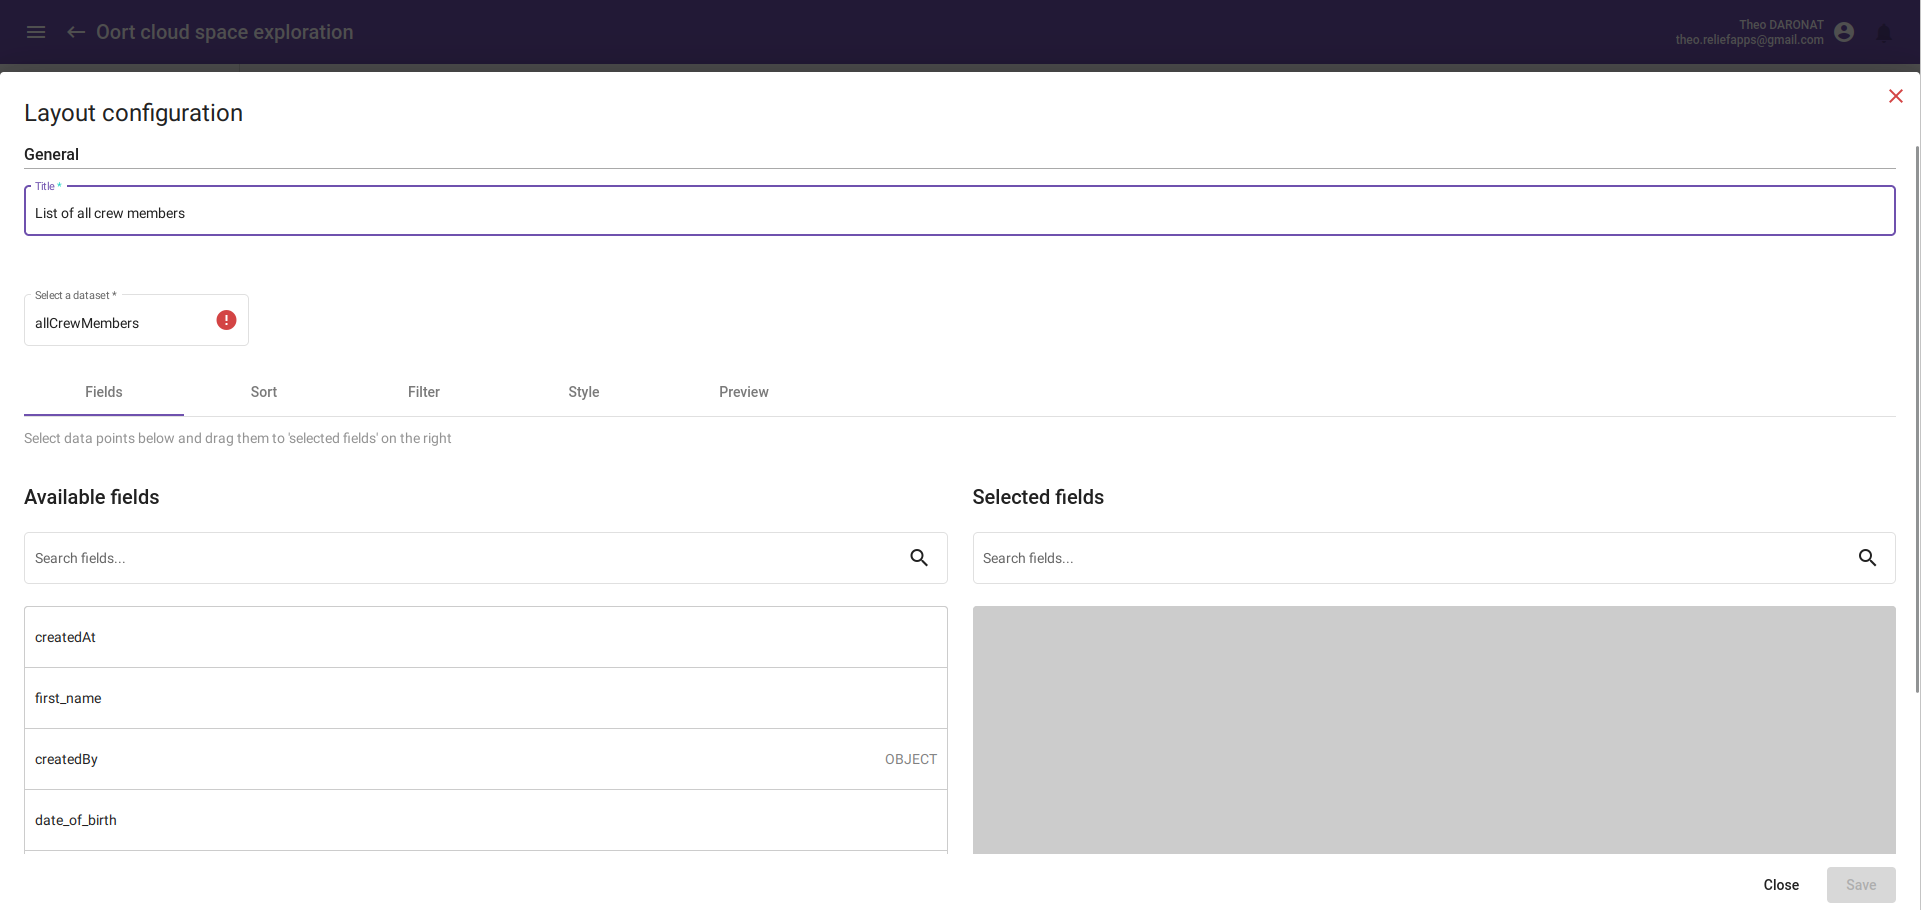
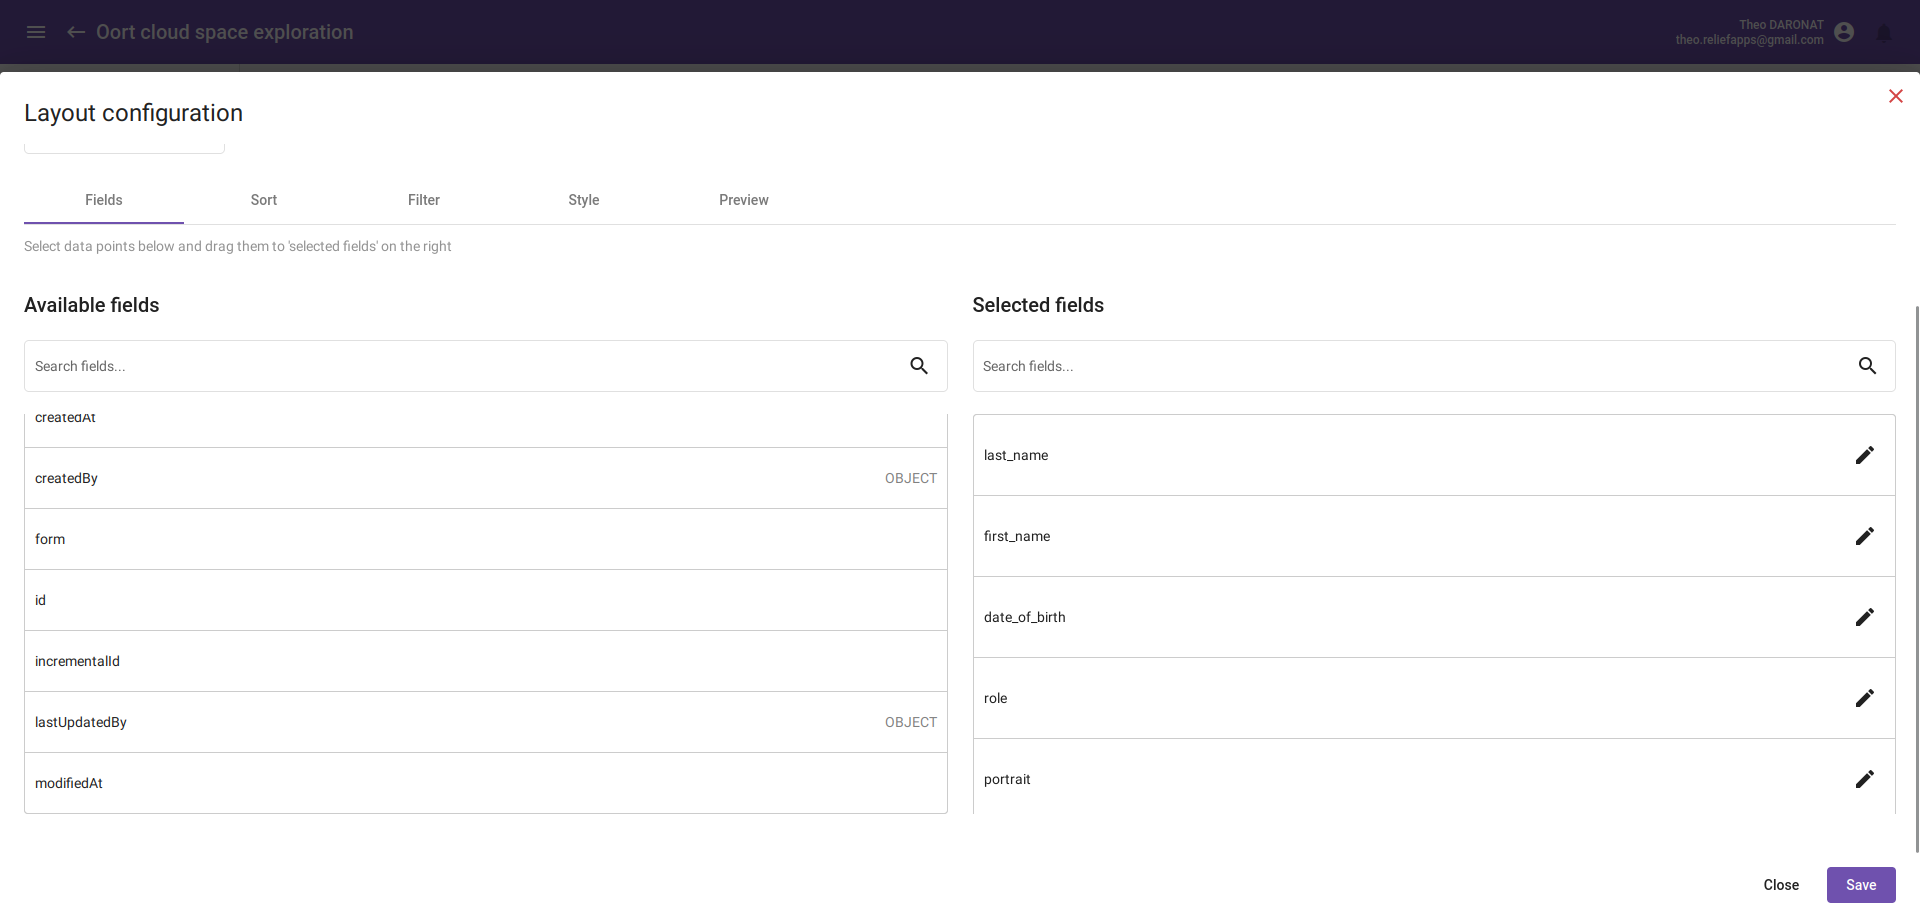
Then we will add the fields we want to display. For this, just drag and drop fields from "Available fields" to "Selected fields".
To remove an element, you just have to drag and drop fields from "Selected fields" to "Available fields".
In addition, we want to display informations ordered by last names. Go on the "Sort" section, select the last_name in the "Sort field" box and sort them by ascending order.
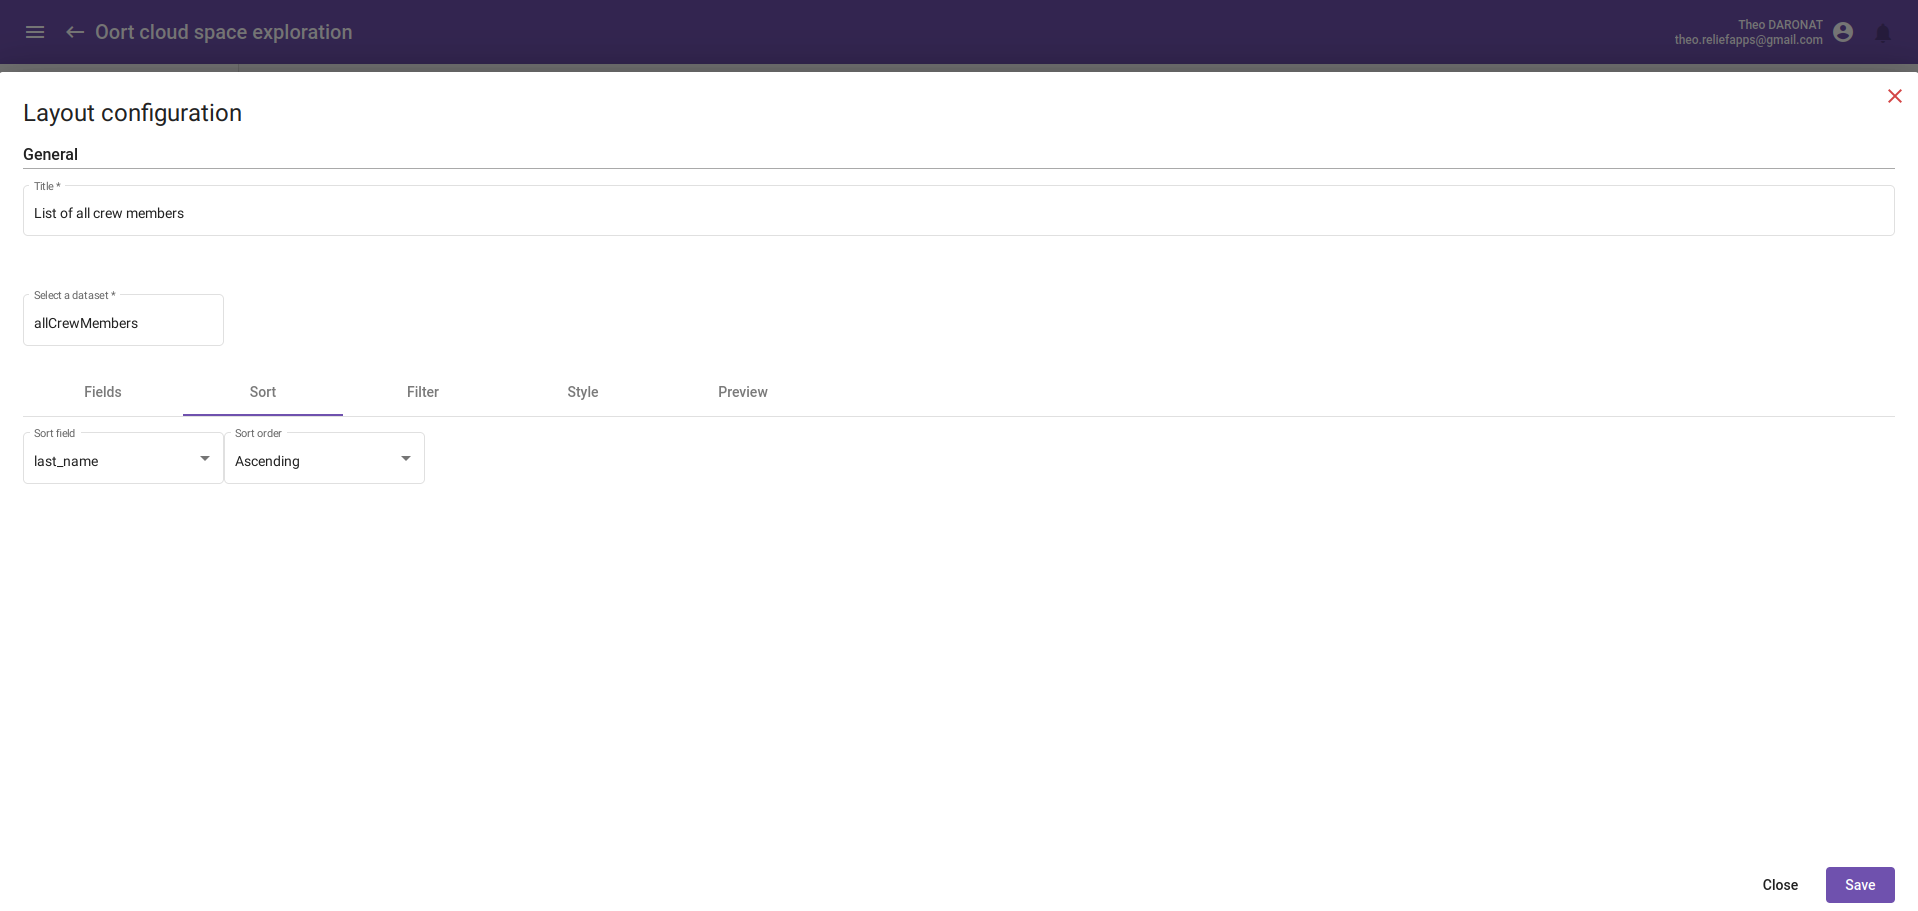
Now click on the save button to save your layout, you will be redirected to the settings screen. Click on the save button to save your settings, and that's all!